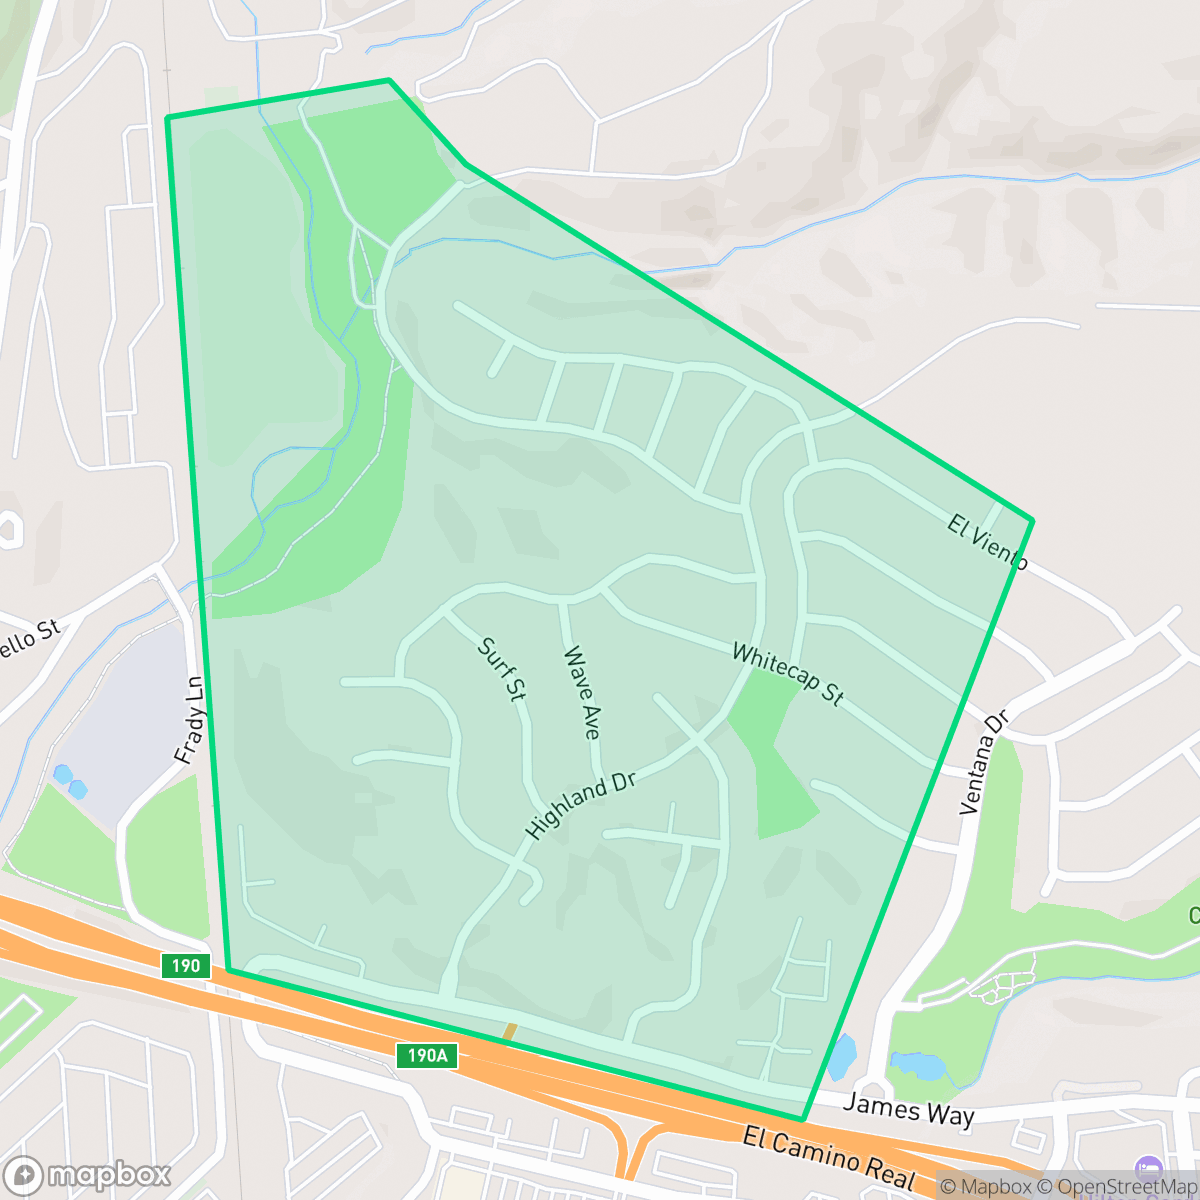
Pacific Estates, Pismo Beach
Updated June 22, 2026 · 485 residents
Pacific Estates is a compact residential area in Pismo Beach characterized by a mix of single-family homes and mobile home parks situated near major transit corridors. While the neighborhood offers high air quality and strong health insurance coverage, residents experience significant noise from nearby road traffic and live in close proximity to industrial infrastructure.
Key Highlights
About Pacific Estates
Pacific Estates functions as a dense, suburban enclave defined by its proximity to essential transit routes and industrial zones. The landscape includes a varied mix of housing types, ranging from traditional single-family residences to high-density mobile home parks. Local amenities are accessible, with several dining options located along the highway, and the area maintains a high standard for air quality and comprehensive health insurance coverage for its residents.
Prospective residents should weigh the trade-offs of this location, as it faces significant acoustic challenges due to heavy road traffic noise. The visual landscape is influenced by nearby industrial facilities, including a wastewater treatment plant situated adjacent to local recreational baseball fields. Given the very high fire risk and the ongoing operational complexities within the Lucia Mar Unified School District, the area is best suited for those prioritizing transit connectivity and health resources over quiet, secluded suburban living.
Neighborhood Scores Across 15 Qualities
Residential spacing provides a moderate level of separation between neighbors, offering more buffer than the typical Pismo Beach neighborhood. According to iHuus data, the density remains mixed with varying distances between adjacent properties.
Pedestrian movement is well-supported by sidewalks on one side of the street and safe crossings. This level of accessibility is slightly higher than the Pismo Beach average, according to iHuus data.
Large homes and frequent upscale amenities define the local scenery, though the overall visual appeal sits slightly below the Pismo Beach average according to iHuus data.
Interconnected green spaces and wide, low-traffic paths provide reliable environments for walking pets. This area offers a slightly lower level of dog-friendly infrastructure compared to the rest of Pismo Beach, according to iHuus data.
Developed with a mix of single-family homes and mobile home parks, this area feels less urbanized than the Pismo Beach average. Residents will find a landscape of scattered housing interspersed with open spaces and commercial zones.
Residential life here is characterized by a subdued atmosphere and sparse commercial density, falling below the Pismo Beach average for activity. While some pockets offer local dining and greenery, much of the area consists of quiet suburban blocks and open landscape.
Persistent sounds from nearby railroad tracks and major thoroughfares characterize the area. According to iHuus data, acoustic levels are higher than the average for Pismo Beach.
Air quality remains consistently excellent, matching the high standard found throughout Pismo Beach. Residents can expect clean air with minimal pollutants according to iHuus data.
Residential streets coexist with light commercial activity and a nearby wastewater treatment facility, making the industrial presence notably higher than the Pismo Beach average. While heavy industry is absent, residents should expect some daytime commercial traffic alongside local amenities like hotels and parks.
Health insurance access among residents is notably higher than the Pismo Beach average, according to iHuus data.
Political leanings in this area are fairly evenly split, presenting a more moderate landscape than the slightly more liberal leaning average found across Pismo Beach.
Residents primarily consist of older adults with a smaller proportion of younger people, representing a slightly older age profile than the Pismo Beach average according to iHuus data.
Flood risk in this area is higher than the Pismo Beach average, though official FEMA assessments for this specific location remain incomplete.
Extreme fire hazards exist within this area, representing a significantly higher risk than the average for Pismo Beach. Residents should maintain maximum protection measures and stay informed of local wildfire protocols according to iHuus data.
Block-Level Insights for Pacific Estates

iHuus Neighborhood Intelligence Insights
Get block-level neighborhood insights for Pacific Estates
- Street-level scores — see how individual blocks compare, not just neighborhood averages
- Micro-zone boundaries — identify quiet pockets, flood boundaries, and walkable clusters before you visit
- 15 dimensions in full — walkability, noise, air quality, school quality, insurance coverage, population age profile, urban/rural index, and more
- Boundary risk alerts — know if your address sits near a block boundary where scores drop, the kind of detail no listing will ever mention
- School insights — individual school ratings and insights, not just district-level data
- Compare before you commit — side-by-side data across neighborhoods, down to block precision
No credit card required
Compare with Any Neighborhood
| Dimension | Pacific Estates | Pismo Marsh |
|---|---|---|
| 🚶 Walkabilityavg 8.02 | ||
| 🔊 Acoustic Comfortavg 2.35 | ||
| 🤫 Privacy Indexavg 5.38 | ||
| 🎨 Visual Appealavg 7.17 | ||
| 🐕 Dog Friendlinessavg 8.11 | ||
| 🗺️ Urban-Rural Indexavg 7.16 | ||
| ✨ Neighborhood Vibeavg 5.55 | ||
| 🏥 Health Insurance Coverageavg 7.57 | ||
| 🌿 Air Qualityavg 9.98 | ||
| 🏭 Industrial Proximityavg 8.79 | ||
| 🌊 Flood Safetyavg 4.67 | ||
| 🗳️ Ideological Leanavg 4.87 | ||
| 👥 Population Age Profileavg 5.92 | ||
| 🔥 Fire Safetyavg 0.98 | ||
| 🏫 School Quality |
Pacific Estates Rankings
School Districts Serving Pacific Estates
Lucia Mar Unified School District presents a tale of two districts, characterized by prestigious coastal elementary schools and high-achieving athletic programs at Arroyo Grande High, offset by significant academic underperformance at Nipomo High and several inland campuses. While the district maintains strong graduation rates and robust reserves, it is currently hindered by 'Mixed' operational health due to a prolonged and public labor dispute with its teachers' association. Despite modern security upgrades and successful resistance to book bans, the sharp disparity in school ratings and the friction between the administration and faculty suggest a period of transition and internal instability that prevents a 'Solid' rating.
Schools
School Insights for Pacific Estates
Below average outcomes; significant attendance and academic challenges.
School Insights
See what's really behind every school rating near Pacific Estates
- Individual school ratings — each school's own score with outcome context, not just a district average
- Enrollment & class size data — student-to-teacher ratio and how it compares to the state average
- Full demographics breakdown — ethnicity and gender composition for every school in the enrollment zone
- Every school in the district — all schools within the enrollment boundary ranked by rating, not just the closest one
- Grade levels & benchmarks — elementary through high school, with below/above state-average flags
No credit card required