Rio Lindo, Oxnard
Updated June 22, 2026 · 5,597 residents
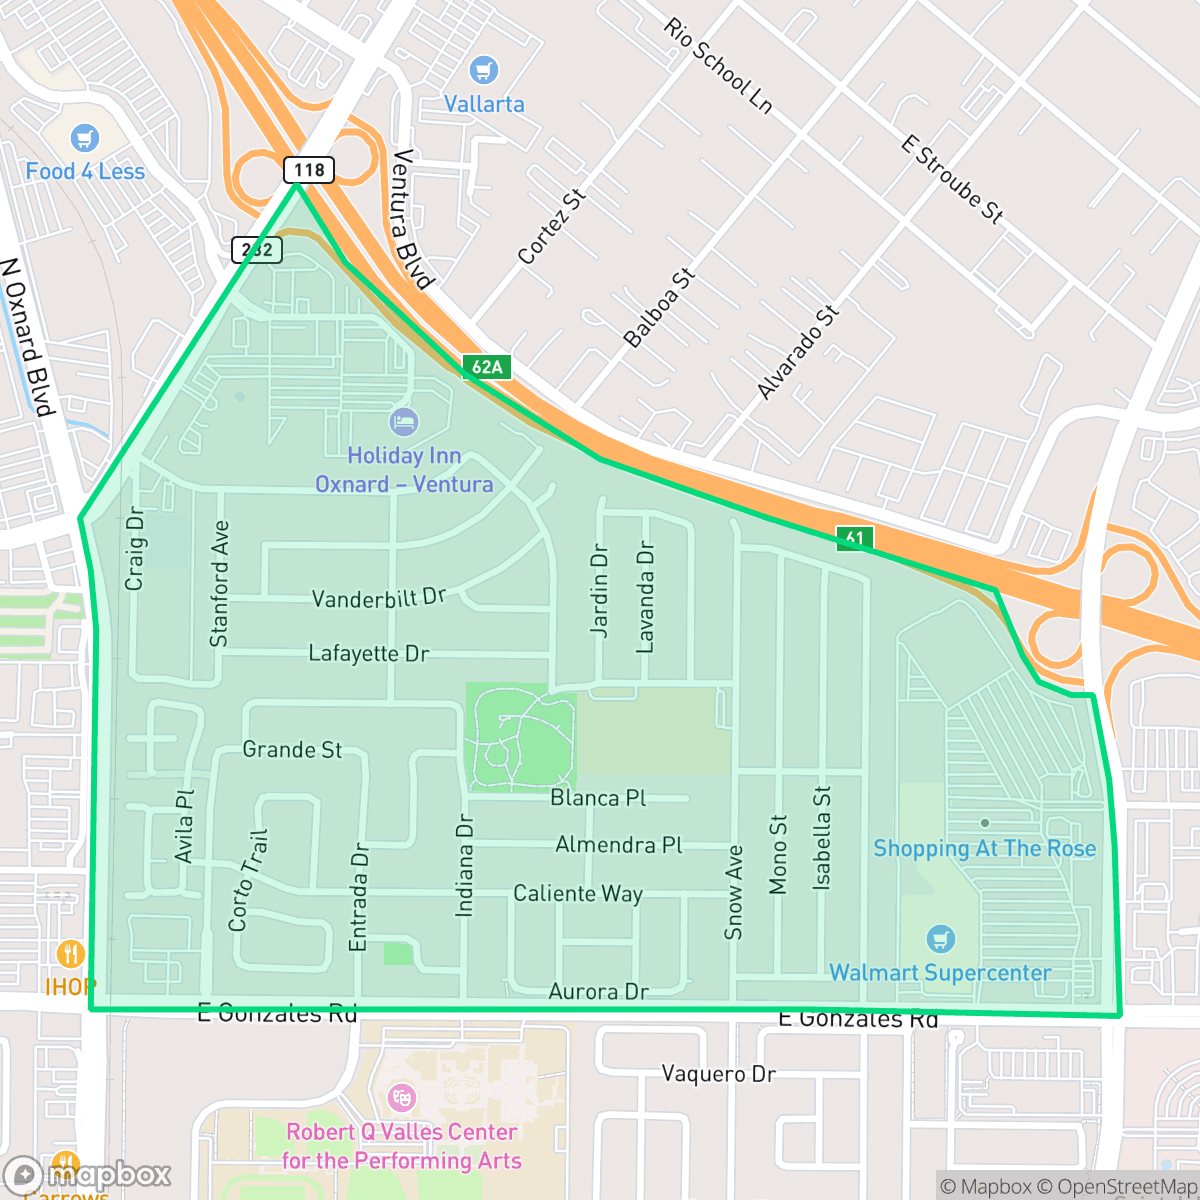
Rio Lindo is a highly walkable suburban neighborhood in Oxnard, characterized by dense residential housing and proximity to light industrial zones. While residents benefit from excellent air quality and convenient access to local amenities, the area experiences significant noise from road traffic and faces specific challenges regarding fire safety.
Key Highlights
About Rio Lindo
Rio Lindo offers a dense, suburban environment defined by a mix of single-family homes and apartment complexes. Its layout prioritizes pedestrian access, with continuous sidewalks throughout the area that make local dining and services easily reachable on foot. The neighborhood maintains a functional, straightforward aesthetic typical of regional tract housing, featuring uniform architecture and shared green spaces that serve as community hubs. According to iHuus data, the area is well-integrated into the broader Oxnard transit network, supporting a lifestyle that favors convenience and accessibility.
Living in this area involves specific trade-offs, particularly regarding acoustic comfort and environmental safety. The proximity to major thoroughfares and industrial zones results in elevated road traffic noise, and the neighborhood faces a notable risk of fire. While the local school districts provide programs like dual-language immersion, academic performance remains inconsistent across the region. This area is best suited for individuals who prioritize walkability and proximity to transit corridors over quiet, secluded residential settings.
Neighborhood Scores Across 15 Qualities
Residential spacing is relatively tight with houses situated near one another and shared property lines. This level of density is slightly higher than the Oxnard average according to iHuus data.
Continuous sidewalks and well-marked pedestrian crossings exist on nearly all residential streets, providing a level of walkability that is slightly above the Oxnard average. Dedicated pedestrian-priority zones and clear crosswalks at major intersections make navigating the area on foot efficient and safe.
Standard tract housing and apartment complexes define the landscape, featuring consistent rooflines and modest yard spaces. The visual character of this area is roughly in line with the average for Oxnard.
Accessible green spaces, including a large public park and school fields, offer plenty of room for exercise. According to iHuus data, the presence of wide sidewalks with grass verges makes this area slightly more pet-friendly than the Oxnard average.
Residential layouts feature a blend of single-family housing tracts and commercial zones, closely mirroring the overall urban-rural balance found throughout Oxnard.
A balanced mix of residential streets and light industrial zones provides a stable daily rhythm that is slightly more active than the Oxnard average. While various dining options and social hubs exist, many essential services require a car due to the suburban and industrial nature of the area.
Constant noise from the nearby airport runway and heavy rail infrastructure makes this area significantly louder than most of Oxnard. According to iHuus data, acoustic comfort is notably lower here than the city average due to this proximity to transit corridors.
Air quality remains consistently high with minimal health concerns. This level of air purity matches the Oxnard city average, according to iHuus data.
Light commercial warehouses and auto-related lots create moderate traffic and noise in the central corridor, though the area remains below the Oxnard average for industrial presence.
Health insurance accessibility in this area is slightly below the Oxnard average, according to iHuus data. Residents may find fewer individuals in the neighborhood with active coverage compared to the rest of the city.
Voting patterns and census indicators in Rio Lindo reflect a predominantly liberal political leaning, which is slightly more pronounced than the average for Oxnard.
Residents live alongside a balanced mix of young adults, families, and seniors. This demographic spread is very similar to the broader Oxnard area, according to iHuus data.
Flood risk in this area is higher than the Oxnard average, though FEMA has not yet completed a detailed study for this specific location. According to iHuus data, the level of risk remains undetermined.
Block-Level Insights for Rio Lindo

iHuus Neighborhood Intelligence Insights
Get block-level neighborhood insights for Rio Lindo
- Street-level scores — see how individual blocks compare, not just neighborhood averages
- Micro-zone boundaries — identify quiet pockets, flood boundaries, and walkable clusters before you visit
- 15 dimensions in full — walkability, noise, air quality, school quality, insurance coverage, population age profile, urban/rural index, and more
- Boundary risk alerts — know if your address sits near a block boundary where scores drop, the kind of detail no listing will ever mention
- School insights — individual school ratings and insights, not just district-level data
- Compare before you commit — side-by-side data across neighborhoods, down to block precision
No credit card required
Compare with Any Neighborhood
| Dimension | Rio Lindo | Bartolo Square North |
|---|---|---|
| 🚶 Walkabilityavg 9.13 | ||
| 🔊 Acoustic Comfortavg 2.93 | ||
| 🤫 Privacy Indexavg 4.06 | ||
| 🎨 Visual Appealavg 6.08 | ||
| 🐕 Dog Friendlinessavg 6.46 | ||
| 🗺️ Urban-Rural Indexavg 6.67 | ||
| ✨ Neighborhood Vibeavg 4.7 | ||
| 🏥 Health Insurance Coverageavg 4.66 | ||
| 🌿 Air Qualityavg 9.99 | ||
| 🏭 Industrial Proximityavg 7.45 | ||
| 🌊 Flood Safetyavg 3.91 | ||
| 🗳️ Ideological Leanavg 9.3 | ||
| 👥 Population Age Profileavg 4.59 | ||
| 🔥 Fire Safetyavg 0.04 | ||
| 🏫 School Quality |
Rio Lindo Rankings
School Districts Serving Rio Lindo
Oxnard Elementary School District is a stable but academically challenged organization characterized by a sharp divide between its high-quality leadership and low-performing academic portfolio. While the district enjoys success in securing facility bonds, maintaining competitive staff pay, and receiving regional accolades for its Superintendent, standardized testing scores remain in the bottom 50% of the state. With a school portfolio where nearly half of the institutions are rated 3/10 or below, the district relies on specialized programs like Dual Language Immersion and strong community engagement to maintain its standing. It currently functions as a middle-of-the-road district in a period of transition, leveraging infrastructure upgrades and modernization to address persistent achievement gaps.
Schools
Oxnard Union High School District is a stable but bifurcated organization, exhibiting a 'Mixed/Transition' profile due to the stark contrast between its high-performing specialized academies and its struggling traditional high schools. While the district maintains strong community trust through successful bond measures and facility modernizations, its academic core is pressured by critically low math proficiency and a projected enrollment decline. Strong Career Technical Education programs and high graduation rates provide a floor for the district's quality, but significant achievement gaps across geographic lines and aging infrastructure on specific campuses remain primary obstacles to overall excellence.
Schools
Rio Elementary School District is a distressed organization characterized by a severe performance gap between its flagship campus and the rest of the portfolio. While the district has successfully secured state grants for Community Schools initiatives and received praise for its STEAM and dual-immersion programs, these anecdotal 'wraparound' successes have yet to translate into core academic proficiency, with the majority of schools stagnant at the lowest state percentiles. Despite stable enrollment from new housing and positive community sentiment regarding staff dedication, the sheer volume of 1/10 and 2/10 school ratings, alongside significant infrastructure disparities between old and new sites, indicates a district struggling with systemic academic and operational consistency.
Schools
School Insights for Rio Lindo
Below average outcomes; significant attendance and academic challenges.
School Insights
See what's really behind every school rating near Rio Lindo
- Individual school ratings — each school's own score with outcome context, not just a district average
- Enrollment & class size data — student-to-teacher ratio and how it compares to the state average
- Full demographics breakdown — ethnicity and gender composition for every school in the enrollment zone
- Every school in the district — all schools within the enrollment boundary ranked by rating, not just the closest one
- Grade levels & benchmarks — elementary through high school, with below/above state-average flags
No credit card required