Redwood, Oxnard
Updated June 22, 2026 · 2,697 residents
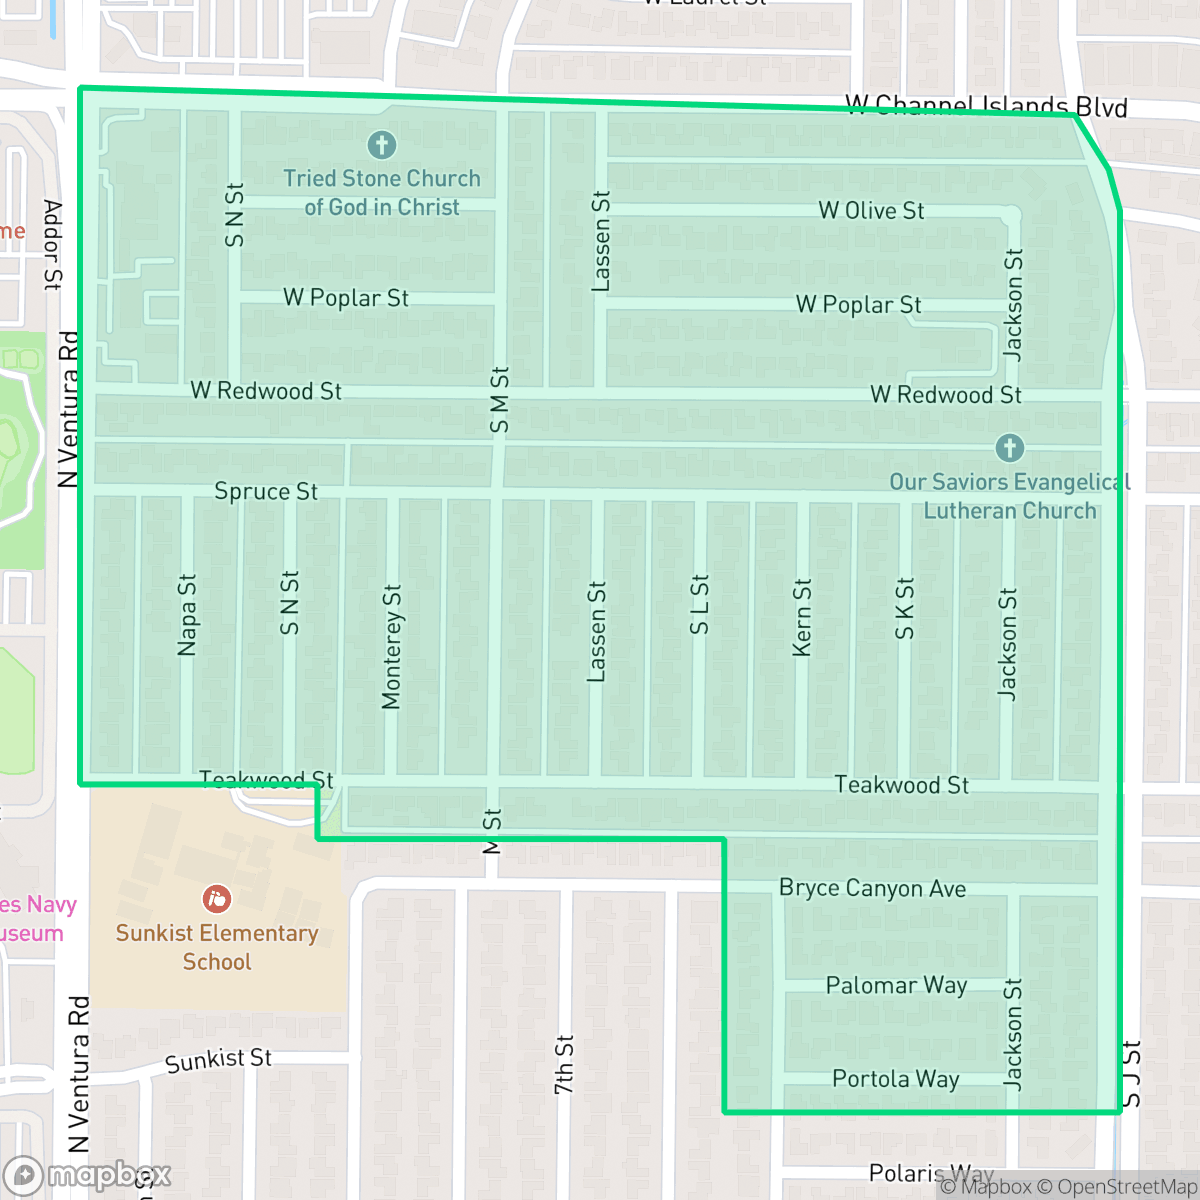
Redwood is a compact, highly walkable suburban neighborhood in Oxnard, characterized by its proximity to expansive green spaces and the US Navy Seabee Museum. While the area offers excellent pedestrian access and pet-friendly amenities, residents should anticipate significant road noise and a dense housing environment.
Key Highlights
About Redwood
Redwood is a dense, suburban community in Oxnard known for its high walkability and proximity to significant local landmarks like the US Navy Seabee Museum. The neighborhood features a mix of standard tract housing and multi-story apartment complexes integrated within a grid that prioritizes pedestrian access through continuous sidewalks and marked crosswalks. Large public parks and a nearby golf course provide substantial green space, making the area particularly suitable for pet owners who value outdoor recreation. Prospective residents should consider certain trade-offs when evaluating the area. The neighborhood experiences high levels of ambient road noise, and the dense layout of housing results in limited privacy for many properties. While the community benefits from excellent air quality and high rates of health insurance coverage, it is located in a zone with notable flood and fire safety risks. The area is served by a variety of school districts with mixed academic performance ratings, making it a functional choice for those who prioritize neighborhood mobility and outdoor access over quiet, secluded living.
Neighborhood Scores Across 15 Qualities
Residential spacing is relatively consistent with the Oxnard average, though some areas feature high density housing and closely packed structures. Residents may encounter shared walls or narrow gaps between neighboring properties depending on the specific street.
Continuous sidewalks and well-marked crosswalks define the street network in this area. The neighborhood offers a structured grid layout that is consistent with the city average for pedestrian accessibility.
Residential views consist mainly of mid-century tract homes and apartment blocks with consistent rooflines and small yards. This level of visual variety is roughly in line with the city average.
Limited public green space and narrow sidewalk verges make pet walking less convenient than in other parts of Oxnard. While some residents benefit from nearby school fields and a large golf course, much of the neighborhood relies on private fenced yards for pet exercise.
Residential pockets feature a mix of single-family homes and multi-story apartments, offering a landscape that is slightly less open than the Oxnard average. According to iHuus data, the area balances developed street grids with occasional patches of greenery and undeveloped land.
Local dining and community spaces provide a noticeably higher level of activity than the Oxnard average. Residents can access a variety of social spots and leisure parks, though many commercial services remain distributed throughout the suburban landscape.
Steady traffic sounds from nearby busy streets are present. This level of acoustic activity is higher than the Oxnard average, according to iHuus data.
Air quality remains consistently high with minimal health concerns for residents. This level of cleanliness is on par with the Oxnard average, according to iHuus data.
Industrial presence is minimal in this area, as there are no heavy manufacturing or hazardous facilities detected. According to iHuus data, the neighborhood lacks the large-scale warehouses and utility yards found more frequently in other parts of Oxnard.
Health insurance coverage among residents is slightly below the Oxnard average, according to iHuus data. This indicates that a smaller proportion of the local population has access to employer-sponsored or private medical plans compared to the rest of the city.
Voting patterns and census indicators show a predominantly liberal political leaning that is slightly more pronounced than the Oxnard average.
Residents live alongside a diverse range of age demographics, including young adults, families, and seniors. According to iHuus data, the age distribution is slightly more concentrated toward younger populations than the Oxnard average.
Flood safety in Redwood is notably higher than the Oxnard average, though some residual risk remains due to the area's location within a 500-year floodplain. Residents should be aware of potential water issues during extreme weather events according to iHuus data.
Block-Level Insights for Redwood

iHuus Neighborhood Intelligence Insights
Get block-level neighborhood insights for Redwood
- Street-level scores — see how individual blocks compare, not just neighborhood averages
- Micro-zone boundaries — identify quiet pockets, flood boundaries, and walkable clusters before you visit
- 15 dimensions in full — walkability, noise, air quality, school quality, insurance coverage, population age profile, urban/rural index, and more
- Boundary risk alerts — know if your address sits near a block boundary where scores drop, the kind of detail no listing will ever mention
- School insights — individual school ratings and insights, not just district-level data
- Compare before you commit — side-by-side data across neighborhoods, down to block precision
No credit card required
Compare with Any Neighborhood
| Dimension | Redwood | Bartolo Square North |
|---|---|---|
| 🚶 Walkabilityavg 9.13 | ||
| 🔊 Acoustic Comfortavg 2.93 | ||
| 🤫 Privacy Indexavg 4.06 | ||
| 🎨 Visual Appealavg 6.08 | ||
| 🐕 Dog Friendlinessavg 6.46 | ||
| 🗺️ Urban-Rural Indexavg 6.67 | ||
| ✨ Neighborhood Vibeavg 4.7 | ||
| 🏥 Health Insurance Coverageavg 4.66 | ||
| 🌿 Air Qualityavg 9.99 | ||
| 🏭 Industrial Proximityavg 7.45 | ||
| 🌊 Flood Safetyavg 3.91 | ||
| 🗳️ Ideological Leanavg 9.3 | ||
| 👥 Population Age Profileavg 4.59 | ||
| 🔥 Fire Safetyavg 0.04 | ||
| 🏫 School Quality |
Redwood Rankings
School Districts Serving Redwood
Oxnard Elementary School District is a stable but academically challenged organization characterized by a sharp divide between its high-quality leadership and low-performing academic portfolio. While the district enjoys success in securing facility bonds, maintaining competitive staff pay, and receiving regional accolades for its Superintendent, standardized testing scores remain in the bottom 50% of the state. With a school portfolio where nearly half of the institutions are rated 3/10 or below, the district relies on specialized programs like Dual Language Immersion and strong community engagement to maintain its standing. It currently functions as a middle-of-the-road district in a period of transition, leveraging infrastructure upgrades and modernization to address persistent achievement gaps.
Schools
Oxnard Union High School District is a stable but bifurcated organization, exhibiting a 'Mixed/Transition' profile due to the stark contrast between its high-performing specialized academies and its struggling traditional high schools. While the district maintains strong community trust through successful bond measures and facility modernizations, its academic core is pressured by critically low math proficiency and a projected enrollment decline. Strong Career Technical Education programs and high graduation rates provide a floor for the district's quality, but significant achievement gaps across geographic lines and aging infrastructure on specific campuses remain primary obstacles to overall excellence.
Schools
Hueneme Elementary School District is characterized as Distressed due to a deep and persistent academic divide where the majority of its campuses, including both junior high schools, reside in the lowest performance tier. While the district demonstrates strong operational health through successful facility modernizations, high community support for dual-immersion programs, and a proactive shift toward the Science of Reading, these efforts have yet to rectify systemic underperformance in core subjects like mathematics. Despite the visible commitment of its staff and successful bond execution, the concentration of schools rated 1 or 2 by state metrics represents a significant organizational risk and a lack of consistent educational quality across the district's feeder patterns.
Schools
School Insights for Redwood
Below average outcomes; significant attendance and academic challenges.
School Insights
See what's really behind every school rating near Redwood
- Individual school ratings — each school's own score with outcome context, not just a district average
- Enrollment & class size data — student-to-teacher ratio and how it compares to the state average
- Full demographics breakdown — ethnicity and gender composition for every school in the enrollment zone
- Every school in the district — all schools within the enrollment boundary ranked by rating, not just the closest one
- Grade levels & benchmarks — elementary through high school, with below/above state-average flags
No credit card required