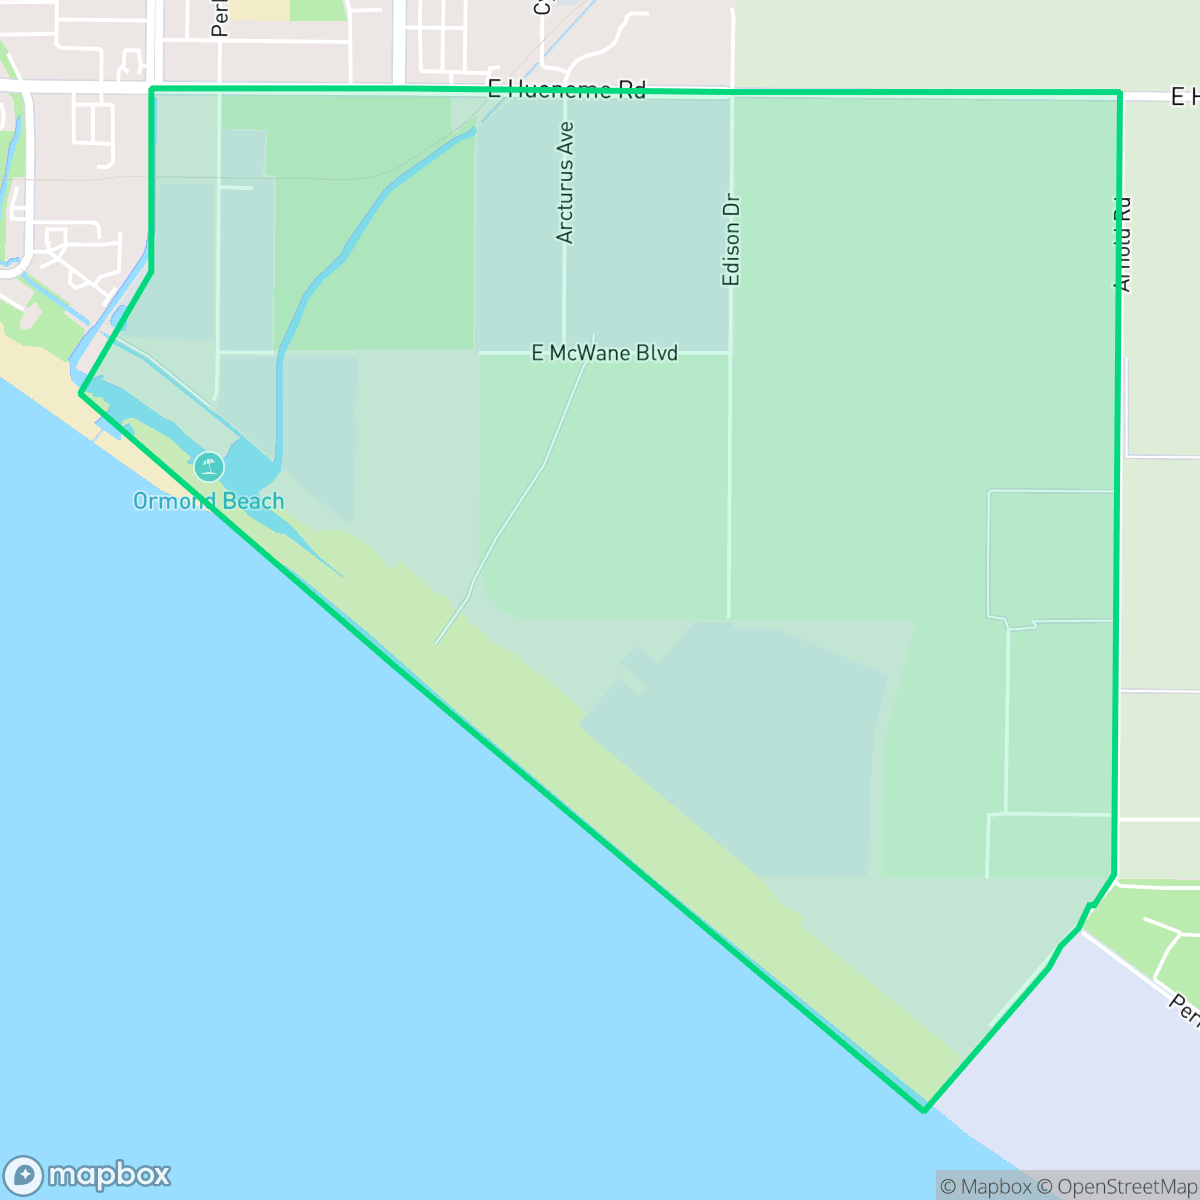
Ormond Beach, Oxnard
Updated June 22, 2026 · 1,685 residents
Ormond Beach is a coastal area in Oxnard defined by its expansive open space, wetlands, and heavy industrial presence. While the neighborhood offers high air quality and significant dog-friendliness, it faces challenges regarding noise levels from road traffic and environmental concerns related to nearby Superfund sites.
Key Highlights
About Ormond Beach
Ormond Beach functions as a transitional landscape where vast agricultural fields, greenhouses, and large-scale industrial facilities meet the Pacific coastline. The area is characterized by its quiet, remote atmosphere and a distinct lack of dense residential development, making it a unique pocket of Oxnard. Notable for its proximity to significant wetlands and the shoreline, the neighborhood provides a rugged, open environment that stands in contrast to the city's more developed suburban sectors.
Prospective residents should be aware of the area's industrial nature and specific livability trade-offs. The neighborhood experiences high noise levels primarily due to road traffic and carries significant risks regarding flood safety. Furthermore, the presence of an EPA Superfund site remains a critical environmental factor. Given the limited local amenities and the performance profile of the local school districts, the area is best suited for those prioritizing proximity to coastal open space over traditional suburban convenience.
Neighborhood Scores Across 15 Qualities
Building spacing varies throughout the area, with some residential complexes featuring high density and shared walls. Privacy levels are generally consistent with the broader Oxnard average.
Extensive sidewalk networks and frequent crosswalks throughout the residential grid make navigating the area on foot very easy. According to iHuus data, the pedestrian infrastructure here is even more comprehensive than the Oxnard average.
Residential views consist primarily of closely spaced tract housing and multi-unit complexes with modest yard space. This level of visual variety is roughly in line with the typical appearance of Oxnard neighborhoods.
Central public parks and school fields offer ample green space for pets, though narrow street verges may limit sidewalk space. According to iHuus data, dog friendliness in this area is slightly above the Oxnard average.
A blend of suburban housing, large agricultural fields, and industrial zones characterizes this area. According to iHuus data, the amount of open space and undeveloped land is roughly consistent with the Oxnard average.
Low density and industrial zones create a largely tranquil atmosphere, though the area lacks the activity levels found in other parts of Oxnard. Residents will find a sparse selection of local businesses and a more remote setting compared to the city average.
Frequent noise from nearby railroad tracks and freeway traffic characterizes this area. According to iHuus data, acoustic comfort is slightly lower than the Oxnard average.
Air quality remains consistently high with minimal health concerns for residents. This level of-cleanliness is on par with the Oxnard city average according to iHuus data.
Heavy industrial zones and freight corridors are prominent in this area, which is notably more industrial than the Oxnard average. According to iHuus data, residents live in close proximity to large-scale operational facilities and a recognized EPA Superfund site.
Health insurance accessibility in this area is consistent with the Oxnard average. According to iHuus data, a significant portion of the population remains uninsured.
Voting patterns and census indicators in Ormond Beach align closely with the broader liberal lean found across Oxnard.
Residents live alongside a balanced mix of young adults, families, and older generations. This demographic spread is relatively consistent with the broader Oxnard area, according to iHuus data.
Coastal hazards and wave action make this area significantly more vulnerable to flooding than most parts of Oxnard. Residents should prepare for elevated or potentially prohibitive flood insurance costs according to iHuus data.
Wildfire hazards are exceptionally high in this area, representing a significantly greater danger than the average Oxnard neighborhood. Residents should prioritize maximum fire protection measures and emergency preparedness according to iHuus data.
Block-Level Insights for Ormond Beach

iHuus Neighborhood Intelligence Insights
Get block-level neighborhood insights for Ormond Beach
- Street-level scores — see how individual blocks compare, not just neighborhood averages
- Micro-zone boundaries — identify quiet pockets, flood boundaries, and walkable clusters before you visit
- 15 dimensions in full — walkability, noise, air quality, school quality, insurance coverage, population age profile, urban/rural index, and more
- Boundary risk alerts — know if your address sits near a block boundary where scores drop, the kind of detail no listing will ever mention
- School insights — individual school ratings and insights, not just district-level data
- Compare before you commit — side-by-side data across neighborhoods, down to block precision
No credit card required
Compare with Any Neighborhood
| Dimension | Ormond Beach | Bartolo Square North |
|---|---|---|
| 🚶 Walkabilityavg 9.13 | ||
| 🔊 Acoustic Comfortavg 2.93 | ||
| 🤫 Privacy Indexavg 4.06 | ||
| 🎨 Visual Appealavg 6.08 | ||
| 🐕 Dog Friendlinessavg 6.46 | ||
| 🗺️ Urban-Rural Indexavg 6.67 | ||
| ✨ Neighborhood Vibeavg 4.7 | ||
| 🏥 Health Insurance Coverageavg 4.66 | ||
| 🌿 Air Qualityavg 9.99 | ||
| 🏭 Industrial Proximityavg 7.45 | ||
| 🌊 Flood Safetyavg 3.91 | ||
| 🗳️ Ideological Leanavg 9.3 | ||
| 👥 Population Age Profileavg 4.59 | ||
| 🔥 Fire Safetyavg 0.04 | ||
| 🏫 School Quality |
Ormond Beach Rankings
School Districts Serving Ormond Beach
Oxnard Union High School District is a stable but bifurcated organization, exhibiting a 'Mixed/Transition' profile due to the stark contrast between its high-performing specialized academies and its struggling traditional high schools. While the district maintains strong community trust through successful bond measures and facility modernizations, its academic core is pressured by critically low math proficiency and a projected enrollment decline. Strong Career Technical Education programs and high graduation rates provide a floor for the district's quality, but significant achievement gaps across geographic lines and aging infrastructure on specific campuses remain primary obstacles to overall excellence.
Schools
Hueneme Elementary School District is characterized as Distressed due to a deep and persistent academic divide where the majority of its campuses, including both junior high schools, reside in the lowest performance tier. While the district demonstrates strong operational health through successful facility modernizations, high community support for dual-immersion programs, and a proactive shift toward the Science of Reading, these efforts have yet to rectify systemic underperformance in core subjects like mathematics. Despite the visible commitment of its staff and successful bond execution, the concentration of schools rated 1 or 2 by state metrics represents a significant organizational risk and a lack of consistent educational quality across the district's feeder patterns.
Schools
Ocean View Elementary School District is currently classified as Distressed due to significant academic performance gaps, with the majority of its schools scoring between 2/10 and 3/10. Despite a dedicated teaching staff and positive community sentiment regarding diversity and inclusion, the district faces systemic operational hurdles including high chronic absenteeism and a tightening budget following the expiration of federal relief funds. While recent facilities upgrades and security enhancements show progress, the low standardized test scores across the portfolio and staffing shortages in critical areas like special education underscore a period of institutional instability.
Schools
School Insights for Ormond Beach
Below average outcomes; significant attendance and academic challenges.
School Insights
See what's really behind every school rating near Ormond Beach
- Individual school ratings — each school's own score with outcome context, not just a district average
- Enrollment & class size data — student-to-teacher ratio and how it compares to the state average
- Full demographics breakdown — ethnicity and gender composition for every school in the enrollment zone
- Every school in the district — all schools within the enrollment boundary ranked by rating, not just the closest one
- Grade levels & benchmarks — elementary through high school, with below/above state-average flags
No credit card required