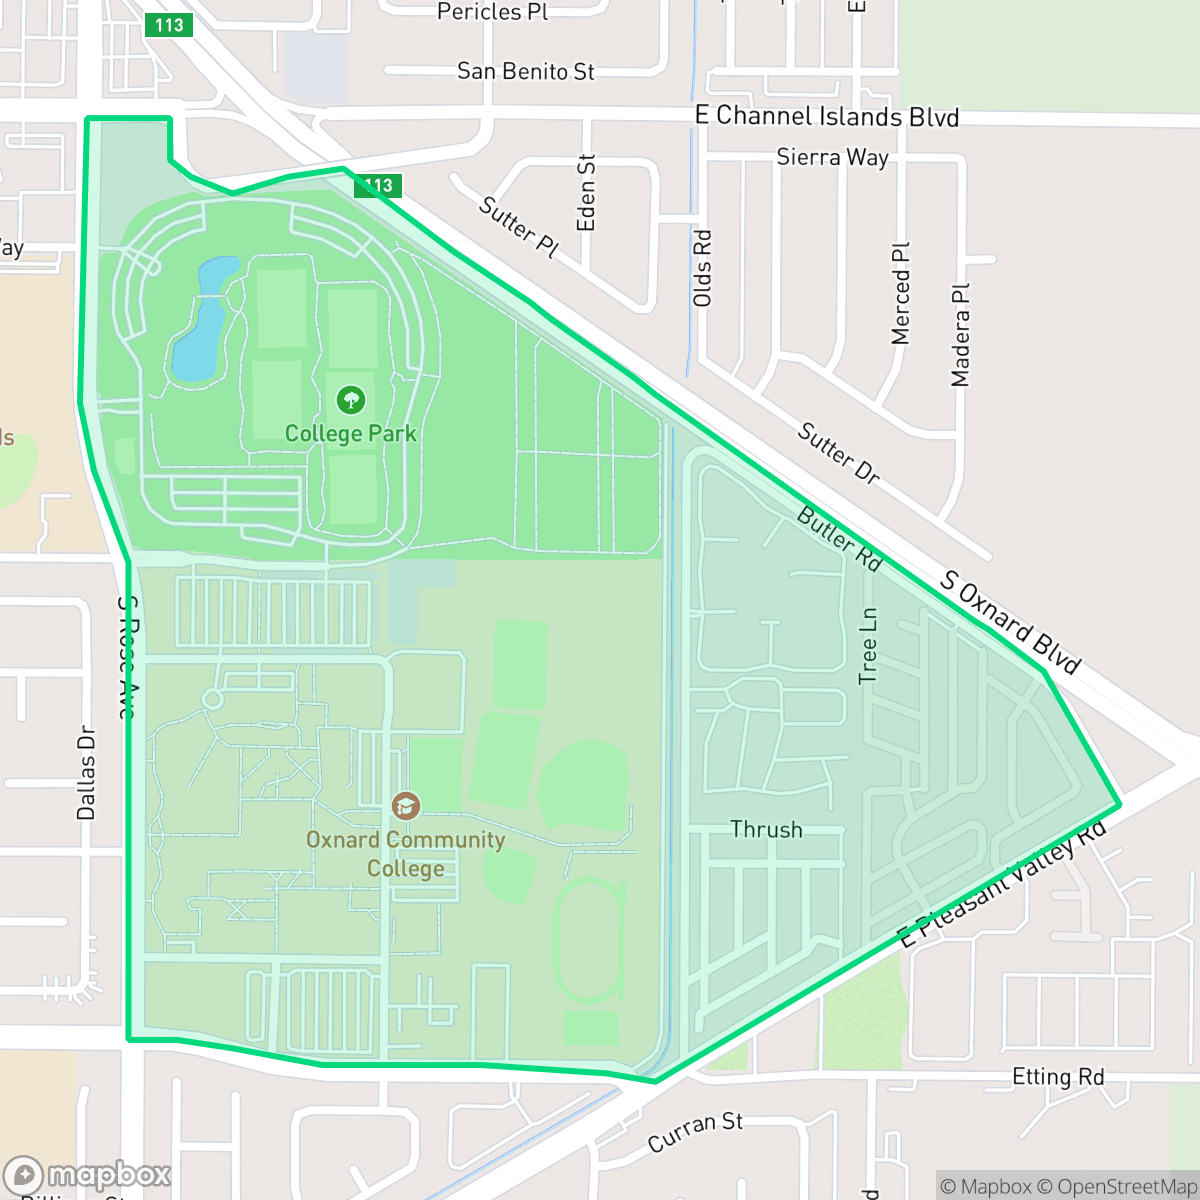
College Park, Oxnard
Updated June 22, 2026 · 3,580 residents
College Park is a quiet, suburban neighborhood in Oxnard characterized by a mix of single-family homes and high-density mobile home parks. While the area offers a walkable environment and is notably dog-friendly, it experiences significant road traffic noise and maintains a low-key, residential atmosphere.
Key Highlights
About College Park
College Park functions as a dense, suburban enclave situated near open agricultural fields and greenhouses. The landscape is defined by its residential focus, featuring a combination of traditional tract housing and mobile home communities. Residents benefit from well-maintained sidewalk networks that facilitate walking, and the proximity to local sports fields and parks makes the area particularly suitable for pet owners. According to data, the neighborhood maintains excellent air quality, contributing to its appeal for those prioritizing environmental health.
Prospective residents should note that the area is a quiet, low-activity environment with a limited business presence, which often necessitates travel for daily errands. While the neighborhood is highly walkable, it faces challenges including high levels of road traffic noise and a lack of fire safety infrastructure. Educational options are varied, ranging from schools within the Hueneme and Ocean View districts to specialized local programs like Oxnard Middle College High, though broader district performance remains a factor for families to consider.
Neighborhood Scores Across 15 Qualities
Residential structures and mobile home sections are closely packed with narrow side yards and shared property lines. This level of density is consistent with the average across Oxnard.
Continuous sidewalks and marked crosswalks provide a safe environment for pedestrians. While the neighborhood offers an excellent network for walking, it is slightly below the Oxnard city average.
Standard tract housing and mobile home parks define the landscape, featuring uniform rooflines and small yards. This level of visual variety is slightly below the Oxnard average according to iHuus data.
Extensive school fields and connected park spaces provide ample green access for pets. Continuous sidewalks and wide grass verges make this area more pet-friendly than the Oxnard average, according to iHuus data.
Residential streets and dense suburban layouts border large-scale agricultural fields and open land. This landscape is slightly more semi-rural than the Oxnard average, featuring a mix of single-family homes and adjacent farmland.
Low business density and a sparse commercial landscape create a quiet, low-activity environment. According to iHuus data, this area is notably less lively than the Oxnard average, requiring a vehicle for most shopping and social needs.
Frequent noise from nearby freeway traffic and railroad tracks creates a louder environment than the Oxnard average. According to iHuus data, residents can expect significant acoustic disturbances throughout the day.
Air quality remains consistently high with negligible health concerns, matching the broader Oxnard area according to iHuus data.
Residential and agricultural zones dominate the area, though some residents near the periphery may experience noise or activity from nearby warehouses and rail lines. This level of industrial proximity is slightly lower than the Oxnard average, as the neighborhood lacks heavy hazardous industry.
Health insurance access in this area is higher than the Oxnard average. According to iHuus data, a significant portion of the population remains uninsured.
Voting patterns and census indicators show a predominantly liberal leaning, which is slightly more pronounced here than the Oxnard average.
A varied mix of young adults, families, and seniors resides here, reflecting a demographic distribution that is nearly identical to the Oxnard average.
Properties in this area are located within a designated floodplain, which means residents may face a higher risk of flooding and likely require flood insurance. This risk level is notably higher than the average for Oxnard.
Block-Level Insights for College Park

iHuus Neighborhood Intelligence Insights
Get block-level neighborhood insights for College Park
- Street-level scores — see how individual blocks compare, not just neighborhood averages
- Micro-zone boundaries — identify quiet pockets, flood boundaries, and walkable clusters before you visit
- 15 dimensions in full — walkability, noise, air quality, school quality, insurance coverage, population age profile, urban/rural index, and more
- Boundary risk alerts — know if your address sits near a block boundary where scores drop, the kind of detail no listing will ever mention
- School insights — individual school ratings and insights, not just district-level data
- Compare before you commit — side-by-side data across neighborhoods, down to block precision
No credit card required
Compare with Any Neighborhood
| Dimension | College Park | Bartolo Square North |
|---|---|---|
| 🚶 Walkabilityavg 9.13 | ||
| 🔊 Acoustic Comfortavg 2.93 | ||
| 🤫 Privacy Indexavg 4.06 | ||
| 🎨 Visual Appealavg 6.08 | ||
| 🐕 Dog Friendlinessavg 6.46 | ||
| 🗺️ Urban-Rural Indexavg 6.67 | ||
| ✨ Neighborhood Vibeavg 4.7 | ||
| 🏥 Health Insurance Coverageavg 4.66 | ||
| 🌿 Air Qualityavg 9.99 | ||
| 🏭 Industrial Proximityavg 7.45 | ||
| 🌊 Flood Safetyavg 3.91 | ||
| 🗳️ Ideological Leanavg 9.3 | ||
| 👥 Population Age Profileavg 4.59 | ||
| 🔥 Fire Safetyavg 0.04 | ||
| 🏫 School Quality |
College Park Rankings
School Districts Serving College Park
Oxnard Union High School District is a stable but bifurcated organization, exhibiting a 'Mixed/Transition' profile due to the stark contrast between its high-performing specialized academies and its struggling traditional high schools. While the district maintains strong community trust through successful bond measures and facility modernizations, its academic core is pressured by critically low math proficiency and a projected enrollment decline. Strong Career Technical Education programs and high graduation rates provide a floor for the district's quality, but significant achievement gaps across geographic lines and aging infrastructure on specific campuses remain primary obstacles to overall excellence.
Schools
Hueneme Elementary School District is characterized as Distressed due to a deep and persistent academic divide where the majority of its campuses, including both junior high schools, reside in the lowest performance tier. While the district demonstrates strong operational health through successful facility modernizations, high community support for dual-immersion programs, and a proactive shift toward the Science of Reading, these efforts have yet to rectify systemic underperformance in core subjects like mathematics. Despite the visible commitment of its staff and successful bond execution, the concentration of schools rated 1 or 2 by state metrics represents a significant organizational risk and a lack of consistent educational quality across the district's feeder patterns.
Schools
Ocean View Elementary School District is currently classified as Distressed due to significant academic performance gaps, with the majority of its schools scoring between 2/10 and 3/10. Despite a dedicated teaching staff and positive community sentiment regarding diversity and inclusion, the district faces systemic operational hurdles including high chronic absenteeism and a tightening budget following the expiration of federal relief funds. While recent facilities upgrades and security enhancements show progress, the low standardized test scores across the portfolio and staffing shortages in critical areas like special education underscore a period of institutional instability.
Schools
School Insights for College Park
Below average outcomes; significant attendance and academic challenges.
School Insights
See what's really behind every school rating near College Park
- Individual school ratings — each school's own score with outcome context, not just a district average
- Enrollment & class size data — student-to-teacher ratio and how it compares to the state average
- Full demographics breakdown — ethnicity and gender composition for every school in the enrollment zone
- Every school in the district — all schools within the enrollment boundary ranked by rating, not just the closest one
- Grade levels & benchmarks — elementary through high school, with below/above state-average flags
No credit card required