College Estates, Oxnard
Updated June 22, 2026 · 3,119 residents
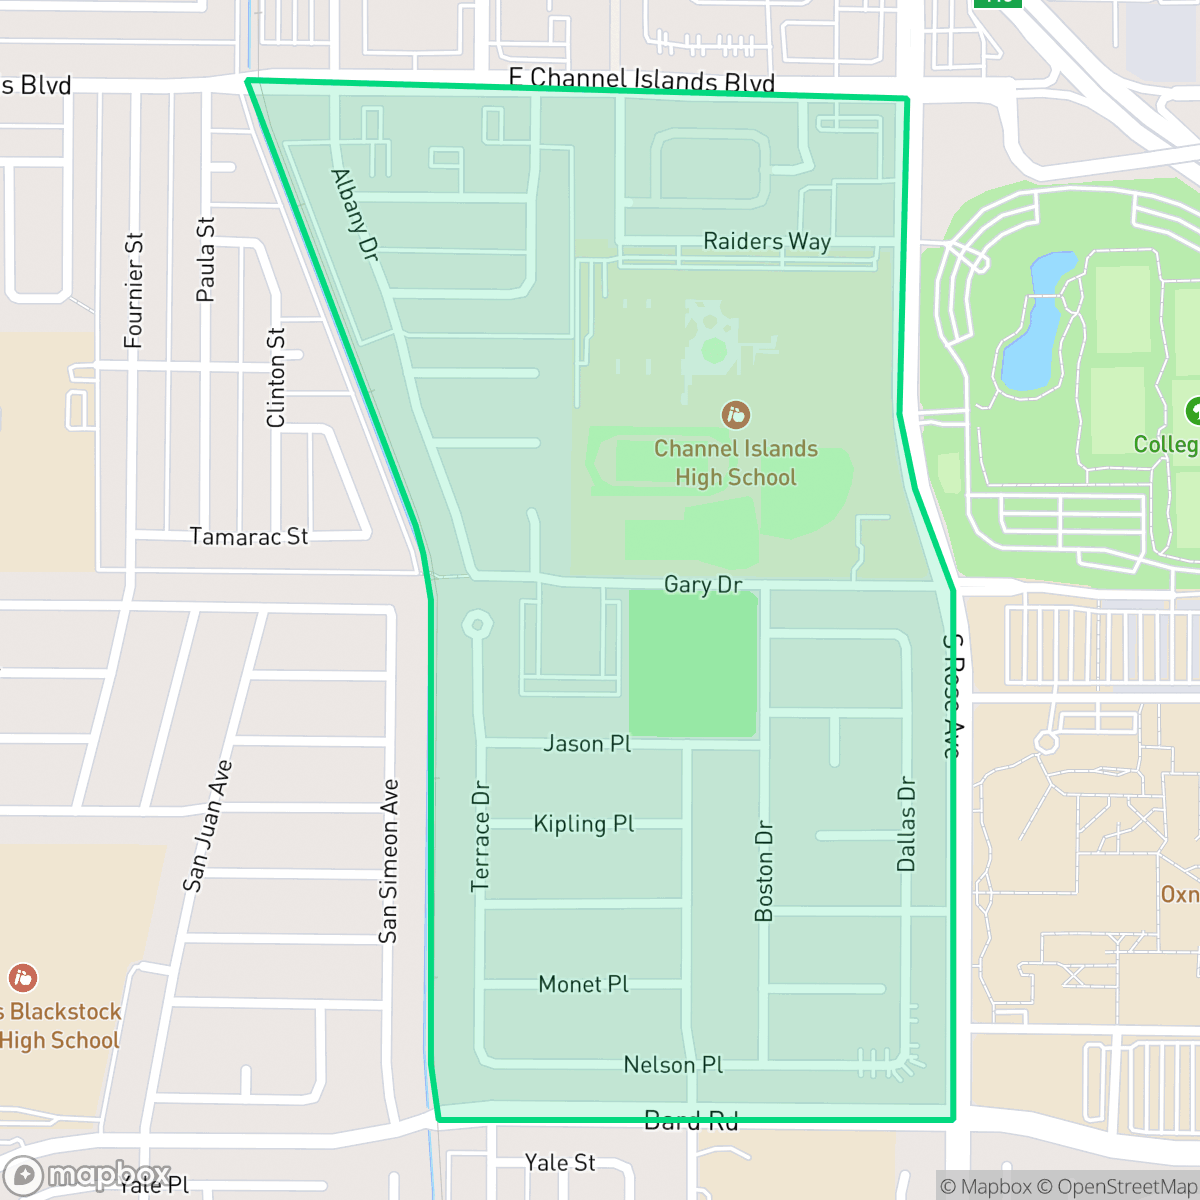
College Estates is a quiet, suburban neighborhood in southeast Oxnard defined by its proximity to the local college campus and expansive parkland. Residents benefit from a comprehensive sidewalk network that makes the area highly walkable, though the dense residential layout results in limited privacy between homes.
Key Highlights
About College Estates
Located in southeast Oxnard, California, the College Estates neighborhood developed primarily during the mid-to-late 20th century, featuring a housing stock characterized by classic California ranch-style single-family homes built between the 1970s and 1990s. The neighborhood's identity is closely tied to its proximity to Oxnard College, which opened in 1975, and the adjacent 75-acre College Park. Historically, College Park served as a prominent local landmark, hosting the California Strawberry Festival for 28 years. Culturally, College Estates is distinguished by its vibrant, diverse community; it features a remarkably high concentration of residents of Asian ancestry, with over 28% of the neighborhood's population speaking Tagalog at home.
The neighborhood is characterized by a consistent suburban layout featuring mid-to-late 20th-century ranch-style homes. It offers a calm, residential atmosphere that is entirely free from industrial hazards, making it a stable environment for families. According to iHuus data, the area maintains excellent air quality and a robust sidewalk system, which supports a high level of walkability throughout the residential blocks.
Prospective residents should note that the neighborhood is primarily car-oriented, with limited social or commercial services within immediate walking distance. While the environment is generally peaceful, the acoustic profile reflects typical suburban traffic noise. Educational options in the surrounding districts show significant variation in performance, and the area faces challenges regarding flood and fire safety, which are important factors for long-term planning according to iHuus data.
Neighborhood Scores Across 15 Qualities
Residential structures are closely packed with minimal buffer between neighbors, resulting in a privacy level that is consistent with the city average. High-density clusters and shared-wall structures are common throughout the area according to iHuus data.
Continuous sidewalks and marked crosswalks across residential streets and main arterials make navigating the area on foot very easy. This level of pedestrian infrastructure is consistent with the broader Oxnard area.
Standard tract housing and apartment complexes define the landscape, featuring uniform rooflines and small yards. This level of visual variety is roughly in line with the Oxnard average.
Large public parks and school fields provide ample green space for pets. Residents benefit from widespread sidewalk verges and wide paths that are safer from traffic than the Oxnard average, according to iHuus data.
Residential streets feature a dense suburban design with a mix of single-family homes and multi-unit housing complexes. This landscape is very similar to the broader Oxnard area in its balance of built environments and open space.
Residential streets and local green spaces provide a tranquil atmosphere, though the area lacks the concentrated activity found in more vibrant parts of Oxnard. Most daily needs require a car, as social and dining services are limited within walking distance.
Ongoing noise from nearby transit corridors and rail lines is present. According to iHuus data, acoustic disturbance levels in this area are slightly higher than the Oxnard average.
Air quality remains consistently high with minimal health concerns. This level of air purity is on par with the rest of Oxnard, according to iHuus data.
Industrial presence is minimal throughout most of the area, though some northern sections experience noise from nearby warehouses and truck activity. While the neighborhood is largely free of heavy industry, proximity to a rail line and a nearby Superfund site should be noted according to iHuus data.
Health insurance coverage among residents is notably lower than the Oxnard average. According to iHuus data, a small portion of the population has access to employer-sponsored or private medical plans.
Voting patterns and census indicators show a predominantly liberal political leaning, which is slightly more pronounced than the Oxnard city average according to iHuus data.
Residents live alongside a varied demographic of young adults, families, and seniors. This population spread is slightly more varied than the average seen across Oxnard.
Flood risk levels are currently difficult to assess because FEMA has not finished a detailed study for this area; this uncertainty aligns with the average risk found throughout Oxnard.
Block-Level Insights for College Estates

iHuus Neighborhood Intelligence Insights
Get block-level neighborhood insights for College Estates
- Street-level scores — see how individual blocks compare, not just neighborhood averages
- Micro-zone boundaries — identify quiet pockets, flood boundaries, and walkable clusters before you visit
- 15 dimensions in full — walkability, noise, air quality, school quality, insurance coverage, population age profile, urban/rural index, and more
- Boundary risk alerts — know if your address sits near a block boundary where scores drop, the kind of detail no listing will ever mention
- School insights — individual school ratings and insights, not just district-level data
- Compare before you commit — side-by-side data across neighborhoods, down to block precision
No credit card required
Compare with Any Neighborhood
| Dimension | College Estates | Bartolo Square North |
|---|---|---|
| 🚶 Walkabilityavg 9.13 | ||
| 🔊 Acoustic Comfortavg 2.93 | ||
| 🤫 Privacy Indexavg 4.06 | ||
| 🎨 Visual Appealavg 6.08 | ||
| 🐕 Dog Friendlinessavg 6.46 | ||
| 🗺️ Urban-Rural Indexavg 6.67 | ||
| ✨ Neighborhood Vibeavg 4.7 | ||
| 🏥 Health Insurance Coverageavg 4.66 | ||
| 🌿 Air Qualityavg 9.99 | ||
| 🏭 Industrial Proximityavg 7.45 | ||
| 🌊 Flood Safetyavg 3.91 | ||
| 🗳️ Ideological Leanavg 9.3 | ||
| 👥 Population Age Profileavg 4.59 | ||
| 🔥 Fire Safetyavg 0.04 | ||
| 🏫 School Quality |
College Estates Rankings
School Districts Serving College Estates
Oxnard Elementary School District is a stable but academically challenged organization characterized by a sharp divide between its high-quality leadership and low-performing academic portfolio. While the district enjoys success in securing facility bonds, maintaining competitive staff pay, and receiving regional accolades for its Superintendent, standardized testing scores remain in the bottom 50% of the state. With a school portfolio where nearly half of the institutions are rated 3/10 or below, the district relies on specialized programs like Dual Language Immersion and strong community engagement to maintain its standing. It currently functions as a middle-of-the-road district in a period of transition, leveraging infrastructure upgrades and modernization to address persistent achievement gaps.
Schools
Oxnard Union High School District is a stable but bifurcated organization, exhibiting a 'Mixed/Transition' profile due to the stark contrast between its high-performing specialized academies and its struggling traditional high schools. While the district maintains strong community trust through successful bond measures and facility modernizations, its academic core is pressured by critically low math proficiency and a projected enrollment decline. Strong Career Technical Education programs and high graduation rates provide a floor for the district's quality, but significant achievement gaps across geographic lines and aging infrastructure on specific campuses remain primary obstacles to overall excellence.
Schools
Hueneme Elementary School District is characterized as Distressed due to a deep and persistent academic divide where the majority of its campuses, including both junior high schools, reside in the lowest performance tier. While the district demonstrates strong operational health through successful facility modernizations, high community support for dual-immersion programs, and a proactive shift toward the Science of Reading, these efforts have yet to rectify systemic underperformance in core subjects like mathematics. Despite the visible commitment of its staff and successful bond execution, the concentration of schools rated 1 or 2 by state metrics represents a significant organizational risk and a lack of consistent educational quality across the district's feeder patterns.
Schools
Ocean View Elementary School District is currently classified as Distressed due to significant academic performance gaps, with the majority of its schools scoring between 2/10 and 3/10. Despite a dedicated teaching staff and positive community sentiment regarding diversity and inclusion, the district faces systemic operational hurdles including high chronic absenteeism and a tightening budget following the expiration of federal relief funds. While recent facilities upgrades and security enhancements show progress, the low standardized test scores across the portfolio and staffing shortages in critical areas like special education underscore a period of institutional instability.
Schools
School Insights for College Estates
Below average outcomes; significant attendance and academic challenges.
School Insights
See what's really behind every school rating near College Estates
- Individual school ratings — each school's own score with outcome context, not just a district average
- Enrollment & class size data — student-to-teacher ratio and how it compares to the state average
- Full demographics breakdown — ethnicity and gender composition for every school in the enrollment zone
- Every school in the district — all schools within the enrollment boundary ranked by rating, not just the closest one
- Grade levels & benchmarks — elementary through high school, with below/above state-average flags
No credit card required