Greater San Antonio, Mountain View
Updated · 551 residents
Greater San Antonio is a dense, transit-adjacent district that serves as a central commercial and residential hub for Mountain View. While the area offers high walkability and proximity to essential services, residents experience significant noise from road traffic and limited privacy due to closely spaced housing.
Key Highlights
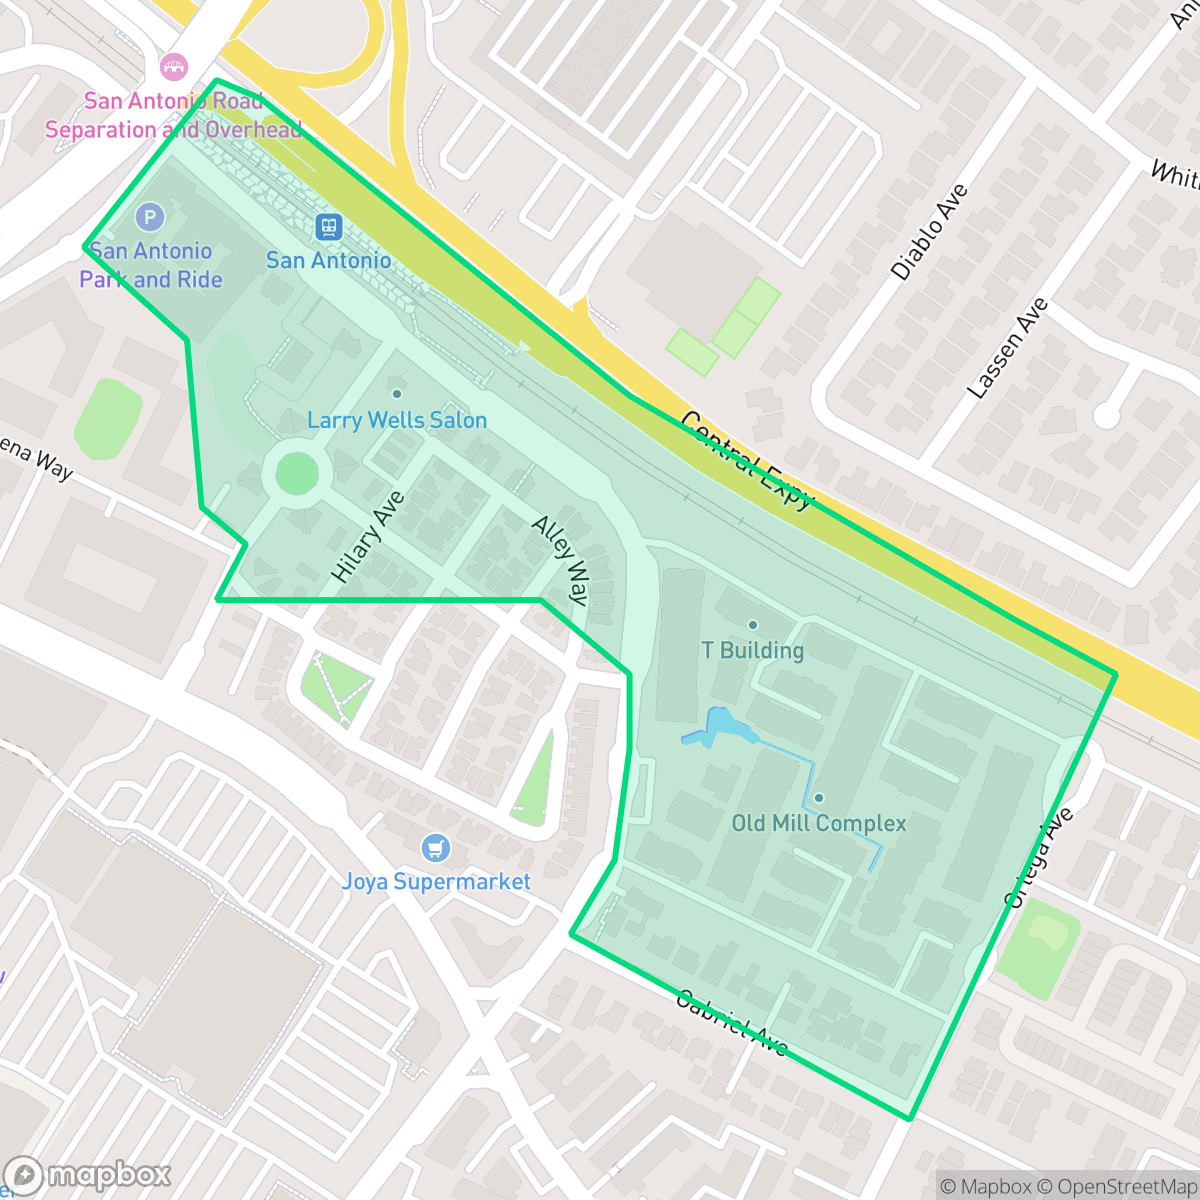
About Greater San Antonio
Historically part of the 1842 Rancho Pastoria de las Borregas Mexican land grant, Mountain View’s Greater San Antonio neighborhood transitioned from agricultural orchards to a foundational hub of Silicon Valley. In 1956, Nobel laureate William Shockley established the Shockley Semiconductor Laboratory in an old apricot storage barn on San Antonio Road, marking the true birthplace of Silicon Valley. The neighborhood’s modern commercial character took shape shortly after with the 1957 opening of the 50-acre San Antonio Shopping Center, anchored by a Sears department store. In 1966, the pioneering Mayfield Mall opened at the corner of Central Expressway and San Antonio Road. Today, the area is a vibrant mixed-use district, anchored by the redeveloped Village at San Antonio Center and the nearby Rengstorff Park.
The area functions as a high-density, mixed-use environment defined by its proximity to major transit corridors and the redeveloped San Antonio Center. It offers a convenient, urban-suburban lifestyle where residents can access dining and retail within walking distance. According to iHuus data, the neighborhood provides a lively atmosphere that balances residential tracts with commercial infrastructure, making it a functional choice for those prioritizing ease of access to daily necessities over quiet seclusion.
Prospective residents should consider the trade-offs of living in such a central location, as the high volume of road traffic results in elevated noise levels throughout the day. The neighborhood features tightly packed residential units, which limits individual privacy compared to more sprawling suburban areas. While the district benefits from access to top-tier local school districts, families should be aware of the environmental context, including the proximity to historical industrial sites and significant flood and fire safety risks.
Neighborhood Scores Across 15 Qualities
Dense residential clustering and shared-wall structures result in a lower level of privacy than the Mountain View average. Many housing units are positioned closely together, which may reduce the buffer between neighbors.
Continuous sidewalks and clear crosswalks make most errands easy to complete on foot. This neighborhood offers slightly better pedestrian connectivity than the Mountain View average, although large commercial parking lots can occasionally act as barriers to movement.
Dense housing tracts and apartment complexes with shared amenities define the local landscape. The area offers a typical suburban aesthetic that is slightly less varied than the Mountain View average, according to iHuus data.
Large central parks with open lawns and connected walking trails provide ample space for pets. This area offers significantly better access to safe, green walking paths than the Mountain View average.
A blend of apartment complexes and single-family homes characterizes this area, which features a level of openness and greenery similar to the Mountain View average.
Active pockets of dining and green space like Rengstorff Park create a more vibrant atmosphere than the typical Mountain View area. Local amenities and diverse restaurants offer a steady level of activity interspersed with quieter residential blocks.
Frequent noise from nearby freeway and railroad corridors characterizes this area. Acoustic comfort is slightly lower than the Mountain View average according to iHuus data.
Air quality in this area fluctuates between acceptable and unhealthy levels, which may cause occasional concern for sensitive groups. This level of air quality is roughly in line with the average for Mountain View, according to iHuus data.
Light industrial and commercial units exist alongside residential areas, though a nearby EPA Superfund site presents potential risks to soil and groundwater quality. According to iHuus data, the presence of industrial activity in this area is higher than the Mountain View average.
Health insurance access is nearly universal for residents in this area, staying slightly above the Mountain View average according to iHuus data.
Voting patterns and census indicators show a predominantly liberal political leaning that is slightly more pronounced than the Mountain View average.
Residents live among a balanced variety of young adults, families, and older populations. This age distribution is largely consistent with the broader Mountain View area, according to iHuus data.
Address-Level Insights for Greater San Antonio


iHuus Neighborhood Intelligence Insights
Get address-level neighborhood insights for Greater San Antonio
- Street-level scores — see how individual blocks compare, not just neighborhood averages
- Micro-zone boundaries — identify quiet pockets, flood boundaries, and walkable clusters before you visit
- 15 dimensions in full — walkability, noise, air quality, school quality, insurance coverage, population age profile, urban/rural index, and more
- Boundary risk alerts — know if your address sits near a block boundary where scores drop, the kind of detail no listing will ever mention
- School insights — individual school ratings and insights, not just district-level data
- Compare before you commit — side-by-side data across neighborhoods, down to block precision
No credit card required
Compare with Any Neighborhood
| Dimension | Greater San Antonio | Blossom Valley |
|---|---|---|
| 🚶 Walkabilityavg 9.25 | ||
| 🔊 Acoustic Comfortavg 3.27 | ||
| 🤫 Privacy Indexavg 5.11 | ||
| 🎨 Visual Appealavg 6.67 | ||
| 🐕 Dog Friendlinessavg 6.99 | ||
| 🗺️ Urban-Rural Indexavg 6.59 | ||
| ✨ Neighborhood Vibeavg 4.37 | ||
| 🏥 Health Insurance Coverageavg 8.96 | ||
| 🌿 Air Qualityavg 6.1 | ||
| 🏭 Industrial Proximityavg 6.34 | ||
| 🌊 Flood Safetyavg 4.11 | ||
| 🗳️ Ideological Leanavg 9.81 | ||
| 👥 Population Age Profileavg 4.83 | ||
| 🔥 Fire Safety | ||
| 🏫 School Quality |
Greater San Antonio Rankings
School Districts Serving Greater San Antonio
School Insights for Greater San Antonio
Below average outcomes; significant attendance and academic challenges.
School Insights
See what's really behind every school rating near Greater San Antonio
- Individual school ratings — each school's own score with outcome context, not just a district average
- Enrollment & class size data — student-to-teacher ratio and how it compares to the state average
- Full demographics breakdown — ethnicity and gender composition for every school in the enrollment zone
- Every school in the district — all schools within the enrollment boundary ranked by rating, not just the closest one
- Grade levels & benchmarks — elementary through high school, with below/above state-average flags
No credit card required