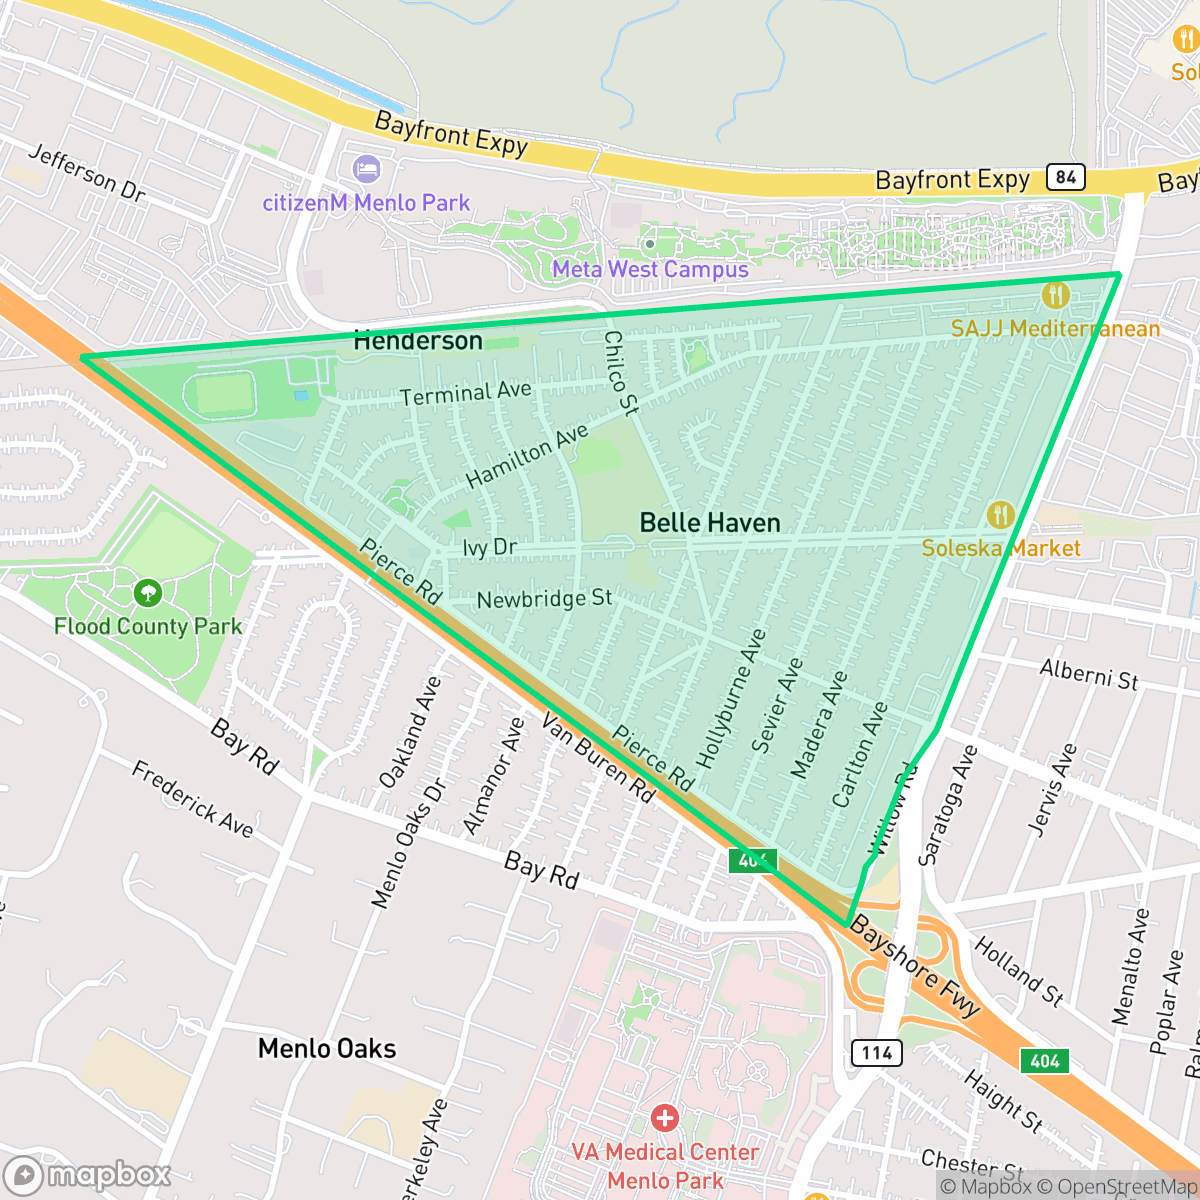
Belle Haven, Menlo Park
Updated June 22, 2026 · 3,692 residents
Belle Haven is a dense, highly walkable residential community in Menlo Park that balances suburban living with proximity to major corporate campuses. While the area offers excellent pedestrian connectivity and green spaces, residents experience significant noise from nearby highway traffic and must consider ongoing challenges regarding environmental and flood safety.
Key Highlights
About Belle Haven
Developed during the Great Depression by real estate developer David Bohannon, who sold its first lots in 1928, Belle Haven was established as an affordable housing tract in unincorporated San Mateo County. Flanked by US Highway 101 and the San Francisco Bay, the neighborhood was annexed by Menlo Park in 1949. By 1955, Belle Haven was a redlined community, and mid-century block-busting practices later shaped it into a segregated Black neighborhood. In the 1990s, community-led redevelopment revitalized the area, leading to the renovation of the Onetta Harris Community Center, named after a prominent local leader. In recent decades, Belle Haven's proximity to major tech campuses—historically Sun Microsystems and now Meta’s headquarters—has driven rapid gentrification, shifting its cultural landscape while residents continue to advocate for civic equity.
The neighborhood is defined by a dense suburban layout that blends traditional single-family residences with large-scale corporate infrastructure. According to iHuus data, the area features high walkability, supported by a comprehensive network of sidewalks, pedestrian crossings, and pathways that connect residential pockets to nearby green buffers. This infrastructure provides convenient access for those working at adjacent technology headquarters, while local parks like Kelly Park offer essential outdoor space for residents and their pets.
Prospective residents should note that the neighborhood faces specific livability trade-offs. Acoustic comfort is a primary concern, as the proximity to major highway infrastructure results in elevated noise levels throughout the area. Furthermore, the community contends with notable environmental risks, including low scores for flood and fire safety. Educational options are also a point of consideration, as local school districts are currently navigating operational transitions and academic performance hurdles. These factors make the area a complex choice for those seeking a balance between corporate proximity and residential stability.
Neighborhood Scores Across 15 Qualities
Property boundaries vary between detached homes with private yards and more densely packed residential areas. According to iHuus data, the level of separation between neighbors is slightly lower than the Menlo Park average.
Pedestrian connectivity is consistent with the Menlo Park average, featuring continuous sidewalks on residential streets and dedicated crossings at major intersections. Integrated walking paths and pedestrian bridges provide reliable access across the area, though some industrial blocks may act as barriers to movement.
Large homes with manicured landscaping and private pools characterize much of the area, though some blocks feature more uniform, standard housing. This level of visual appeal is slightly below the Menlo Park average according to iHuus data.
Access to pet-friendly space is slightly lower than the Menlo Park average. While some areas feature large green buffers and corporate park trails, other residential streets lack continuous sidewalks or accessible public parks.
Residential streets feature a dense suburban layout of single-family homes and institutional clusters, though the area feels slightly more developed than the Menlo Park average. Large-scale commercial campuses and industrial warehouses are interspersed among the residential fabric.
Limited commercial activity and a focus on light industrial and suburban use result in a lower level of activity than the Menlo Park average. Most residents will find a quiet environment with few walkable amenities, as local services are primarily centered around a small number of dining and community spots.
Significant noise from nearby airport runways and heavy rail infrastructure creates an environment with very low acoustic comfort. According to iHuus data, sound levels here are substantially higher than the average for Menlo Park.
Air quality in this area experiences a mix of acceptable and unhealthy days, which is roughly in line with the average for Menlo Park. Sensitive groups may encounter occasional concerns according to iHuus data.
Residential and institutional uses dominate the area, though some large scale warehouses and research facilities along the eastern edge may introduce occasional truck activity. This level of industrial presence is slightly higher than the Menlo Park average according to iHuus data.
Health insurance enrollment among residents is notably lower than the Menlo Park average, according to iHuus data.
Voting patterns and census indicators show a very high concentration of liberal-leaning residents, which is consistent with the broader Menlo Park area.
Residents live alongside a balanced mix of young professionals, families, and seniors. This demographic spread is slightly lower than the Menlo Park average, according to iHuus data.
Frequent flooding is a concern here because much of the area sits within a designated floodplain. According to iHuus data, this risk level is notably higher than the average for Menlo Park.
Block-Level Insights for Belle Haven

iHuus Neighborhood Intelligence Insights
Get block-level neighborhood insights for Belle Haven
- Street-level scores — see how individual blocks compare, not just neighborhood averages
- Micro-zone boundaries — identify quiet pockets, flood boundaries, and walkable clusters before you visit
- 15 dimensions in full — walkability, noise, air quality, school quality, insurance coverage, population age profile, urban/rural index, and more
- Boundary risk alerts — know if your address sits near a block boundary where scores drop, the kind of detail no listing will ever mention
- School insights — individual school ratings and insights, not just district-level data
- Compare before you commit — side-by-side data across neighborhoods, down to block precision
No credit card required
Compare with Any Neighborhood
| Dimension | Belle Haven | Allied Arts |
|---|---|---|
| 🚶 Walkabilityavg 8.41 | ||
| 🔊 Acoustic Comfortavg 3.28 | ||
| 🤫 Privacy Indexavg 5.57 | ||
| 🎨 Visual Appealavg 8.02 | ||
| 🐕 Dog Friendlinessavg 7.02 | ||
| 🗺️ Urban-Rural Indexavg 6.77 | ||
| ✨ Neighborhood Vibeavg 4.35 | ||
| 🏥 Health Insurance Coverageavg 8.51 | ||
| 🌿 Air Qualityavg 6.1 | ||
| 🏭 Industrial Proximityavg 8.79 | ||
| 🌊 Flood Safetyavg 4.11 | ||
| 🗳️ Ideological Leanavg 9.78 | ||
| 👥 Population Age Profileavg 4.75 | ||
| 🔥 Fire Safetyavg 0.02 | ||
| 🏫 School Quality |
Belle Haven Rankings
School Districts Serving Belle Haven
Sequoia Union High School District remains an academic powerhouse with high-performing flagship schools like Carlmont and Menlo-Atherton consistently outpacing state standards; however, it is currently in a state of operational transition and controversy. The district faces significant community backlash following the decision to close the newly built TIDE Academy to address a $6 million deficit, alongside parent concerns regarding the removal of honors-level 'bridge' courses for younger students. While the core academic portfolio is robust, recent lawsuits involving staff misconduct and ongoing debates over curriculum equity and fiscal management signal internal instability that offsets its high-ranking test scores.
Schools
Ravenswood City Elementary School District is currently in a distressed state, characterized by very low academic performance ratings and a trend of declining enrollment that threatens long-term financial stability. While the district has successfully implemented high-value infrastructure projects, such as modern school facilities and dedicated teacher housing to reduce turnover, these operational wins have yet to translate into significant academic gains or community-wide trust in its terminal outcomes. Despite positive local sentiment toward its dual-language programs and small class sizes, the district's reliance on 'fiscal prudence' to avoid deficits and its low standing on state dashboards indicate a system still struggling to overcome systemic socio-economic and institutional hurdles.
Schools
School Insights for Belle Haven
Below average outcomes; significant attendance and academic challenges.
School Insights
See what's really behind every school rating near Belle Haven
- Individual school ratings — each school's own score with outcome context, not just a district average
- Enrollment & class size data — student-to-teacher ratio and how it compares to the state average
- Full demographics breakdown — ethnicity and gender composition for every school in the enrollment zone
- Every school in the district — all schools within the enrollment boundary ranked by rating, not just the closest one
- Grade levels & benchmarks — elementary through high school, with below/above state-average flags
No credit card required