Sunland, Los Angeles
Updated · 15,980 residents
Sunland is a foothill community characterized by its grid-based street layout and a blend of residential tracts and light commercial corridors. Residents benefit from a walkable environment with consistent sidewalk coverage and access to local parks, though the area experiences notable noise levels from road traffic.
Key Highlights
About Sunland
Originally inhabited by the Tongva people and later part of Rancho Tujunga, the neighborhood of Sunland was founded in 1885 as Monte Vista. Early development focused on agriculture, notably hosting the largest olive orchard in Los Angeles County and extensive table grape vineyards. Renamed Sunland in 1906 to highlight its sunny, temperate climate, the community was annexed by Los Angeles in 1926. Situated at a 1,500-foot elevation in the foothills of the San Gabriel Mountains, Sunland-Tujunga gained a reputation as a "fresh air" health haven. The community is defined by historic landmarks like Bolton Hall, a 1913 American Craftsman building constructed of local river rock by the utopian "Little Landers" movement, and the 1923 Rancho Chupa Rosa, home of California Poet Laureate John Steven McGroarty and now the McGroarty Arts Center.
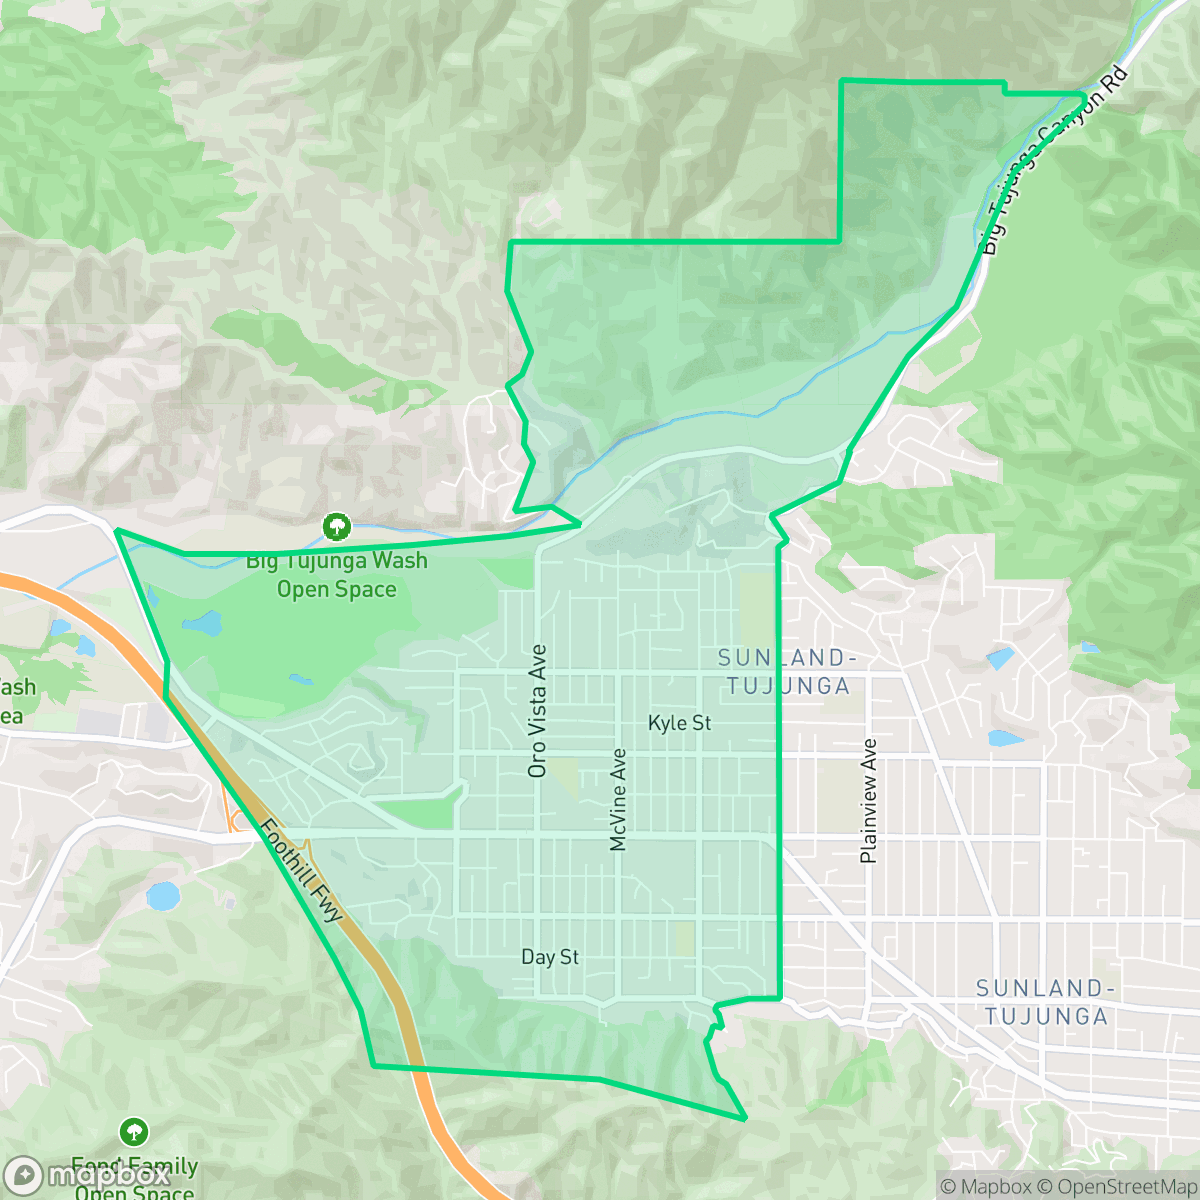
The area offers a suburban atmosphere defined by its location in the San Gabriel Mountain foothills. It features a mix of single-family homes and modest apartment clusters, with a visual landscape that includes well-maintained yards and private pools. The neighborhood maintains a functional grid system that supports high walkability compared to other parts of Los Angeles, allowing residents to navigate between residential blocks and local retail hubs.
While the environment is generally residential, potential residents should note that the area is subject to moderate road traffic noise. The community is well-suited for families and individuals looking for stable suburban living, as evidenced by high health insurance coverage rates and access to local schools like Apperson Street Elementary. According to iHuus data, the region presents specific environmental risks, particularly regarding fire safety, which prospective residents should consider when evaluating property locations.
Neighborhood Scores Across 15 Qualities
Residential spacing varies across the area, though houses generally provide more separation between neighbors than the typical Los Angeles density. According to iHuus data, many lots feature moderate buffers, although some high-density sections have smaller side yards.
Sidewalk networks and safe crossings are widely available across residential blocks and commercial corridors, though overall accessibility is slightly lower than the Los Angeles average. According to iHuus data, the well-defined grid system facilitates steady pedestrian movement throughout much of the neighborhood.
Large, well-maintained homes and private swimming pools are common in the southern hilly sections, contributing to a visual landscape that is more premium than the Los Angeles average. While some areas feature standard tract housing, the neighborhood overall offers more manicured greenery and larger residential footprints than most of the city.
Access to open grass fields and proximity to large hillside green spaces make this area significantly more dog friendly than the Los Angeles average. Wide paths and continuous sidewalks provide reliable routes for walking, though some residential pockets feature narrower verges and more private yards.
Open landscapes and hilly natural canyons create a more spread-out environment than much of the Los Angeles area. Residents can expect a mix of low-density housing and significant patches of undeveloped land according to iHuus data.
Low-density residential landscapes and significant open spaces define the area, resulting in a subdued atmosphere that is slightly below the city average for activity. While some pockets feature local dining and social hubs, much of the neighborhood is car-dependent due to a lack of concentrated commercial character.
Steady traffic sounds from nearby busy streets are present, though the level of acoustic disturbance is higher than the Los Angeles average. According to iHuus data, this area experiences a consistent hum of local vehicular movement.
Air quality in Sunland remains consistently high with rare instances of elevated readings. This level of cleanliness is roughly in line with the broader Los Angeles area according to iHuus data.
Industrial activity is nearly non-existent here, as the area consists almost entirely of residential, educational, and recreational zones. This lack of heavy manufacturing or large warehouses makes the neighborhood even more residential than the Los Angeles average, according to iHuus data.
Health insurance access is notably higher in Sunland than the Los Angeles average, according to iHuus data. This indicates a greater proportion of the resident population has access to medical coverage.
Political leanings in this area are more moderate compared to the much more liberal tilt found across the rest of Los Angeles. According to iHuus data, a liberal majority exists alongside a noticeable conservative presence.
Residents will find a balanced demographic spread of young adults, families, and seniors; according to iHuus data, this age diversity is slightly higher than the Los Angeles average.
Flood risk is notably higher than the Los Angeles average due to the area's location within a designated floodplain. Residents should prepare for the potential requirement of flood insurance, according to iHuus data.
High levels of wildfire vulnerability exist here, representing a significantly greater hazard than the average for Los Angeles. According to iHuus data, this area requires rigorous-preparedness and maximum protection measures due to the extreme fire danger.
Address-Level Insights for Sunland


iHuus Neighborhood Intelligence Insights
Get address-level neighborhood insights for Sunland
- Street-level scores — see how individual blocks compare, not just neighborhood averages
- Micro-zone boundaries — identify quiet pockets, flood boundaries, and walkable clusters before you visit
- 15 dimensions in full — walkability, noise, air quality, school quality, insurance coverage, population age profile, urban/rural index, and more
- Boundary risk alerts — know if your address sits near a block boundary where scores drop, the kind of detail no listing will ever mention
- School insights — individual school ratings and insights, not just district-level data
- Compare before you commit — side-by-side data across neighborhoods, down to block precision
No credit card required
Compare with Any Neighborhood
| Dimension | Sunland | Adams-Normandie |
|---|---|---|
| 🚶 Walkabilityavg 8.9 | ||
| 🔊 Acoustic Comfortavg 2.91 | ||
| 🤫 Privacy Indexavg 4.14 | ||
| 🎨 Visual Appealavg 6.58 | ||
| 🐕 Dog Friendlinessavg 5.04 | ||
| 🗺️ Urban-Rural Indexavg 5.96 | ||
| ✨ Neighborhood Vibeavg 5.07 | ||
| 🏥 Health Insurance Coverageavg 6.2 | ||
| 🌿 Air Qualityavg 8.12 | ||
| 🏭 Industrial Proximityavg 8.46 | ||
| 🌊 Flood Safetyavg 2.66 | ||
| 🗳️ Ideological Leanavg 9.56 | ||
| 👥 Population Age Profileavg 4.85 | ||
| 🔥 Fire Safetyavg 0.18 | ||
| 🏫 School Quality |
Sunland Rankings
School Districts Serving Sunland
School Insights for Sunland
Below average outcomes; significant attendance and academic challenges.
School Insights
See what's really behind every school rating near Sunland
- Individual school ratings — each school's own score with outcome context, not just a district average
- Enrollment & class size data — student-to-teacher ratio and how it compares to the state average
- Full demographics breakdown — ethnicity and gender composition for every school in the enrollment zone
- Every school in the district — all schools within the enrollment boundary ranked by rating, not just the closest one
- Grade levels & benchmarks — elementary through high school, with below/above state-average flags
No credit card required