Central City East, Los Angeles
Updated · 21,057 residents
Central City East is a dense, industrial-heavy neighborhood in Los Angeles defined by its expansive warehouse footprints and high-density residential structures. The area offers a high-energy urban environment, though residents face challenges with limited green space, significant noise from road traffic, and low pedestrian accessibility.
Key Highlights
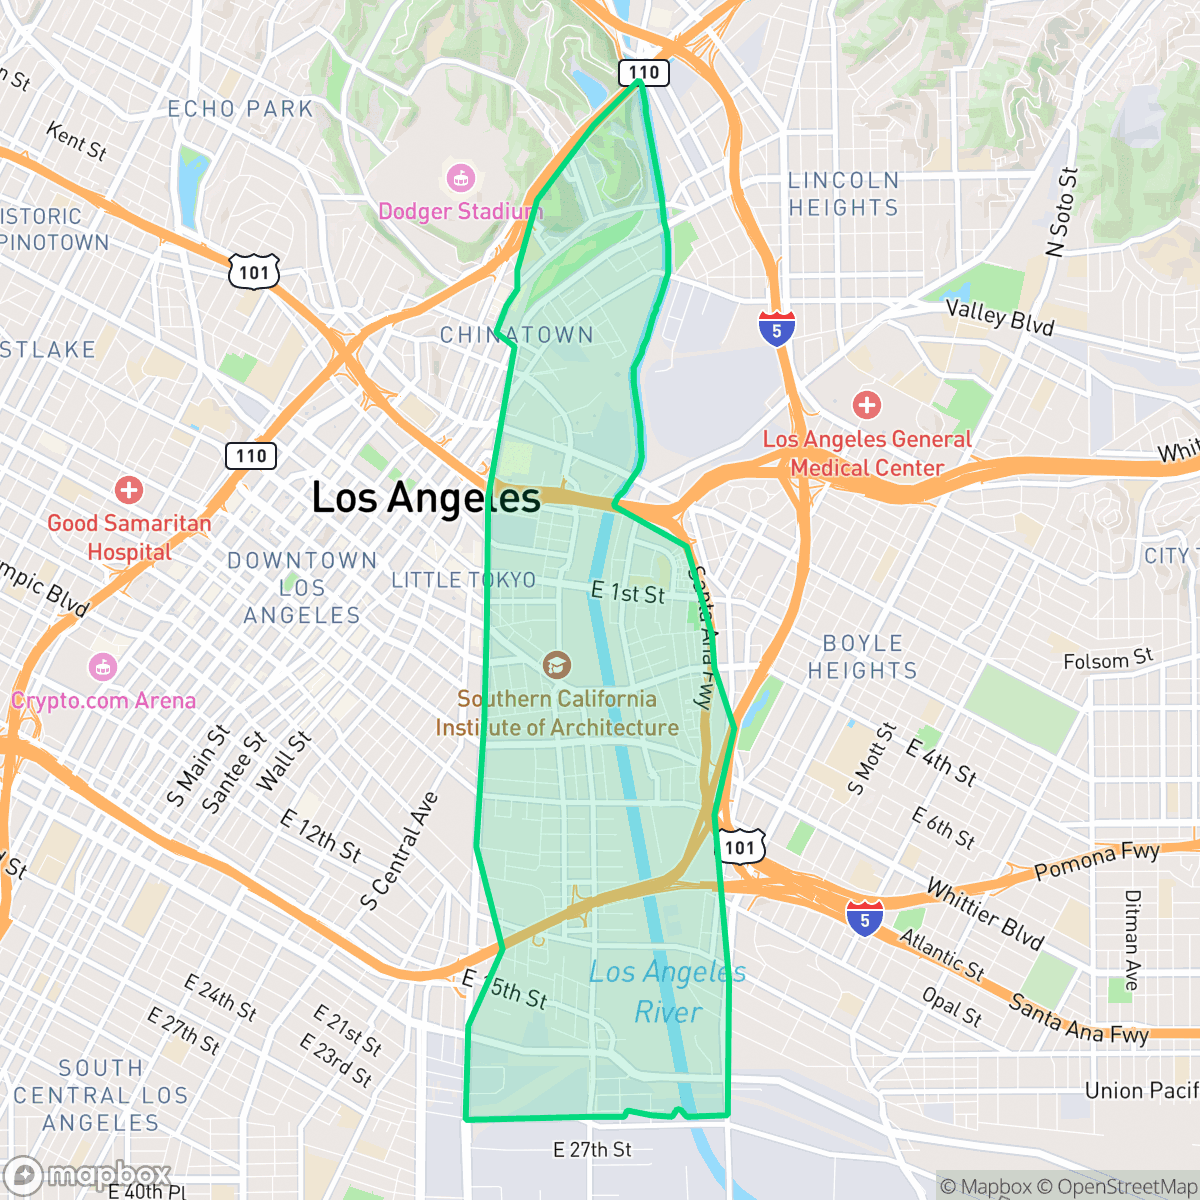
About Central City East
Once the site of the Gabrielino village of Yangna, Los Angeles’s Central City East (commonly known as Skid Row) transitioned from agricultural orchards to an industrial hub with the arrival of railroads in the late 19th century. The 1914 opening of the Southern Pacific Railroad’s Central Station made the neighborhood a primary gateway for transcontinental immigrants and seasonal laborers. To house this transient workforce, developers built numerous Single-Room Occupancy (SRO) hotels between 1906 and 1922. Following post-WWII urban decay and the demolition of thousands of SRO units, city officials established the 50-block neighborhood as an unofficial “containment zone” in 1976 to concentrate social services. Culturally significant landmarks include Indian Alley (Werdin Place), a historic gathering space for indigenous residents featuring vibrant murals, and the neighborhood's enduring network of local missions.
The neighborhood functions as a major logistics and industrial hub, characterized by massive warehouse footprints and a dense grid of multi-family buildings. Its urban fabric is dominated by concrete and asphalt, with very little residential greenery or open space. While the area hosts diverse dining options and cultural galleries, the environment is heavily influenced by its proximity to major freeways and rail infrastructure, resulting in a high-energy but car-dependent atmosphere. According to iHuus data, the area experiences high noise levels averaging 66 decibels, primarily driven by consistent road traffic and industrial activity. Prospective residents should note that the neighborhood presents significant livability trade-offs, particularly for those prioritizing walkability or outdoor recreation. Pedestrian infrastructure is often fragmented by heavy logistics traffic and massive highway interchanges, making the area less suited for traditional walking or pet ownership. While the local school district offers a range of options, including high-performing charters like KIPP Promesa Prep, the overall environment remains best suited for those who value proximity to central logistics hubs and urban density over suburban amenities or acoustic comfort.
Neighborhood Scores Across 15 Qualities
Buildings are tightly packed with shared walls and minimal separation between structures. This level of density is noticeably higher than the Los Angeles average, according to iHuus data.
Pedestrian navigation is difficult due to massive freeways and heavy industrial zones that bisect the area. While some street grids feature consistent sidewalks, the presence of high-traffic intersections and freight yards makes walking significantly less convenient than the city average.
The visual landscape is characterized by industrial warehouses and dense apartment blocks with minimal private greenery. This environment is less aesthetically varied than the Los Angeles average, consisting primarily of utilitarian structures and shared urban amenities.
Extensive pavement, highway interchanges, and industrial lots result in significantly fewer accessible green spaces for pets compared to the city average. While Grand Park offers some public access, much of the area lacks the grassy verges or parks necessary for easy dog walking.
Industrial warehouses, major freeways, and heavy infrastructure dominate the landscape with very little greenery. This area is significantly more urban and built-up than the average Los Angeles neighborhood, according to iHuus data.
A combination of high-energy social hubs and quieter, industrial-edged blocks creates a varied atmosphere that matches the city average. Residents can find a diverse range of dining and cultural landmarks, though the presence of warehouses and highways makes some areas more car-dependent than others.
Constant noise from nearby heavy rail and airport operations makes this a difficult area for acoustic comfort. According to iHuus data, sound levels in this neighborhood are significantly higher than the Los Angeles average.
Air quality remains consistently good with rare instances of elevated readings. This level of air cleanliness is in line with the average found across Los Angeles.
Light commercial activity and residential pockets dominate the area, making it notably less industrial than the Los Angeles average. While some nearby rail infrastructure and logistics hubs exist, residents are largely buffered from heavy manufacturing and large-scale warehouse zones.
Health insurance accessibility is lower than the Los Angeles average, which may impact long-term healthcare planning for residents. According to iHuus data, a smaller proportion of the population in this area maintains active coverage compared to the rest of the city.
Voting patterns and census indicators reflect a predominantly liberal political landscape that is slightly more pronounced than the Los Angeles city average.
Residents experience a balanced demographic spread featuring young professionals, families, and older adults. This age distribution is largely consistent with the broader Los Angeles area, according to iHuus data.
Significant flood risk exists here as the area sits within a designated floodplain. According to iHuus data, this level of risk is notably higher than the Los Angeles average and may necessitate flood insurance.
Fire safety precautions and risks in this area are notably higher than the Los Angeles average, according to iHuus data. Residents should be aware of limited localized fire protection infrastructure and heightened environmental vulnerabilities.
Address-Level Insights for Central City East


iHuus Neighborhood Intelligence Insights
Get address-level neighborhood insights for Central City East
- Street-level scores — see how individual blocks compare, not just neighborhood averages
- Micro-zone boundaries — identify quiet pockets, flood boundaries, and walkable clusters before you visit
- 15 dimensions in full — walkability, noise, air quality, school quality, insurance coverage, population age profile, urban/rural index, and more
- Boundary risk alerts — know if your address sits near a block boundary where scores drop, the kind of detail no listing will ever mention
- School insights — individual school ratings and insights, not just district-level data
- Compare before you commit — side-by-side data across neighborhoods, down to block precision
No credit card required
Compare with Any Neighborhood
| Dimension | Central City East | Adams-Normandie |
|---|---|---|
| 🚶 Walkabilityavg 8.9 | ||
| 🔊 Acoustic Comfortavg 2.91 | ||
| 🤫 Privacy Indexavg 4.14 | ||
| 🎨 Visual Appealavg 6.58 | ||
| 🐕 Dog Friendlinessavg 5.04 | ||
| 🗺️ Urban-Rural Indexavg 5.96 | ||
| ✨ Neighborhood Vibeavg 5.07 | ||
| 🏥 Health Insurance Coverageavg 6.2 | ||
| 🌿 Air Qualityavg 8.12 | ||
| 🏭 Industrial Proximityavg 8.46 | ||
| 🌊 Flood Safetyavg 2.66 | ||
| 🗳️ Ideological Leanavg 9.56 | ||
| 👥 Population Age Profileavg 4.85 | ||
| 🔥 Fire Safetyavg 0.18 | ||
| 🏫 School Quality |
Central City East Rankings
School Districts Serving Central City East
School Insights for Central City East
Below average outcomes; significant attendance and academic challenges.
School Insights
See what's really behind every school rating near Central City East
- Individual school ratings — each school's own score with outcome context, not just a district average
- Enrollment & class size data — student-to-teacher ratio and how it compares to the state average
- Full demographics breakdown — ethnicity and gender composition for every school in the enrollment zone
- Every school in the district — all schools within the enrollment boundary ranked by rating, not just the closest one
- Grade levels & benchmarks — elementary through high school, with below/above state-average flags
No credit card required