Lower Greenridge, Lake Forest
Updated June 22, 2026 · 212 residents
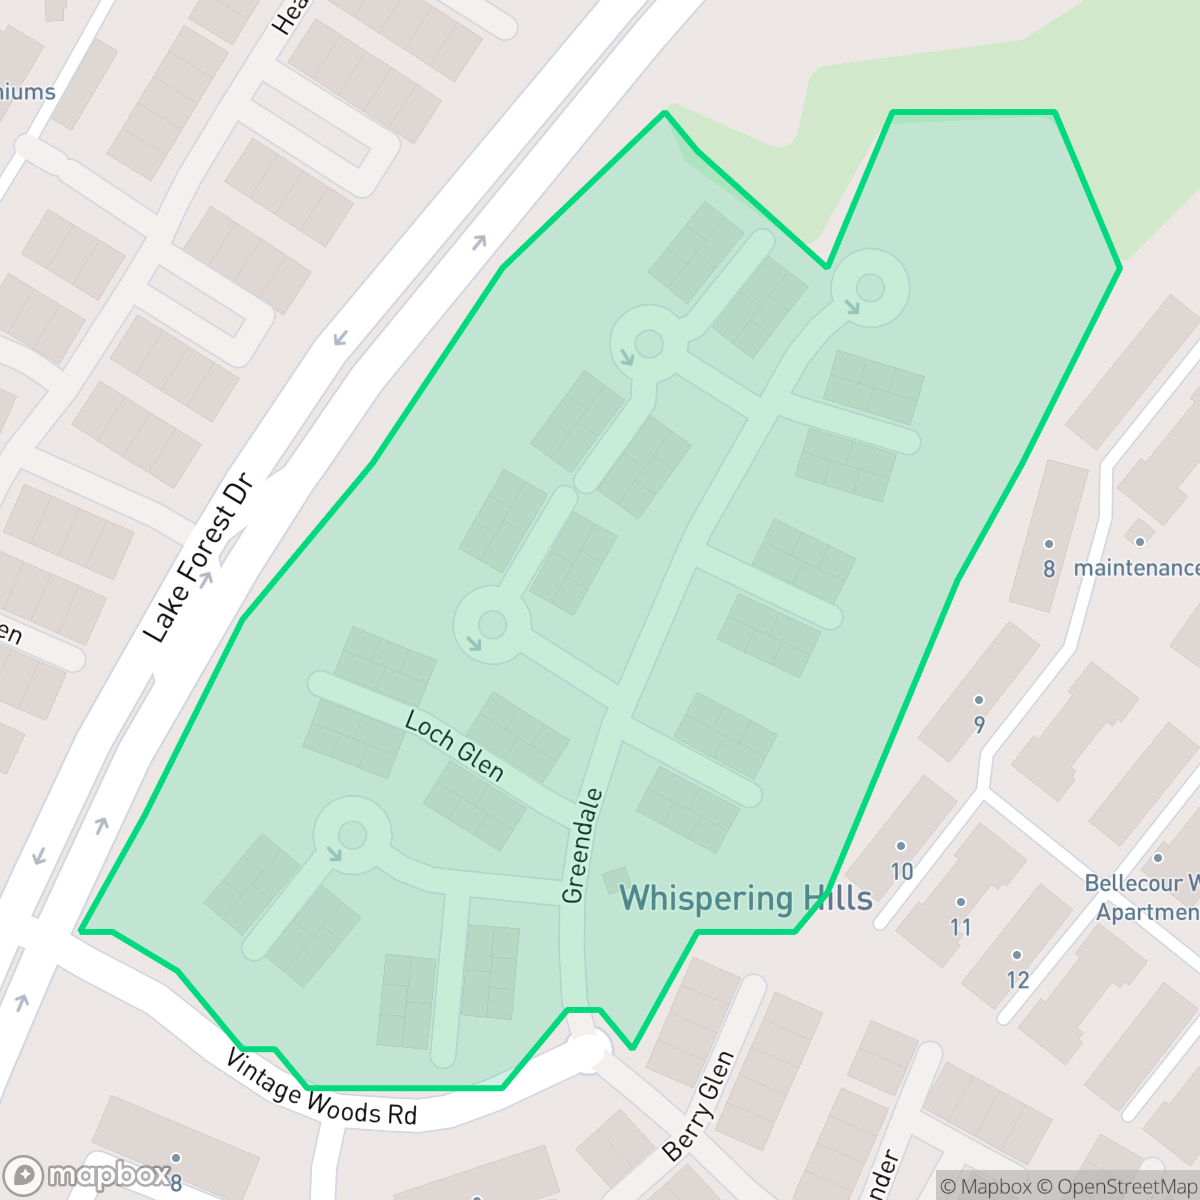
Lower Greenridge is a dense suburban neighborhood in Lake Forest characterized by its high walkability and proximity to local industrial flex-spaces. Residents benefit from excellent access to community amenities, though the area is marked by closely packed housing and noticeable road noise.
Key Highlights
About Lower Greenridge
Lower Greenridge serves as a compact, high-density residential enclave within Lake Forest, defined by a mix of townhomes and apartment complexes. The neighborhood is notably walkable, featuring continuous sidewalks and accessible pedestrian paths that connect residents to nearby green buffers and local dining spots like Empanada Man Pizzeria and Fat Fish. While the area offers a convenient suburban environment, it is situated near industrial zones, which contributes to a distinct architectural character focused on efficiency and density rather than expansive private outdoor space.
Living in this area involves specific trade-offs regarding privacy and acoustic comfort, as the close proximity of residences and surrounding road traffic result in elevated noise levels. The neighborhood is well-suited for those who prioritize walkability and proximity to commercial infrastructure over traditional suburban seclusion. Families are supported by the highly-rated Saddleback Valley Unified School District, and the presence of abundant grass verges and canyon trails makes the area a practical choice for dog owners seeking accessible outdoor exercise.
Neighborhood Scores Across 15 Qualities
Shared walls and closely spaced residences result in lower privacy levels compared to the Lake Forest average. Many homes in this area feature tightly packed single-family layouts or townhome structures.
Continuous sidewalks and pedestrian-priority paths make navigating the area on foot easy. According to iHuus data, this neighborhood offers superior connectivity for pedestrians compared to the rest of Lake Forest.
Uniform tract housing and apartment complexes define the landscape, which offers less visual variety than the Lake Forest average. According to iHuus data, the area features tidy but compact yards and shared community amenities.
Natural canyon trails and abundant green buffers provide ample space for walking dogs away from traffic. This area offers slightly better access to connected green spaces and grassy verges than the rest of Lake Forest.
Dense residential developments and commercial parks characterize this area, which feels slightly more urbanized than the typical Lake Forest landscape. According to iHuus data, the neighborhood features a notable concentration of townhomes and industrial spaces compared to the more open, semi-rural surroundings found elsewhere in the city.
Daily activities typically require a vehicle due to a reliance on light commercial units and a lack of walkable amenities. This area offers a quiet suburban atmosphere with a lower level of activity compared to the Lake Forest average, according to iHuus data.
Frequent noise from nearby transit corridors and rail lines characterizes the area. This level of acoustic disturbance is higher than the average found throughout Lake Forest, according to iHuus data.
Air quality remains consistently good with rare instances of elevated readings. This level of air cleanliness is consistent with the city average, according to iHuus data.
Large warehouses and industrial flex-spaces are concentrated in the northern sector, making this area more industrial than the typical Lake Forest neighborhood. This mix of commercial and residential use is more prominent here than across the rest of the city.
Health insurance access is nearly universal among residents, significantly outpacing the average for Lake Forest. According to iHuus data, this high level of coverage indicates robust access to medical services within the community.
Political perspectives in this area are split relatively evenly between conservative and liberal leanings. According to iHuus data, this reflects a more balanced ideological mix than is typically found in the wider Lake Forest area.
Residents live alongside a varied demographic of young adults, families, and seniors. This age distribution is slightly more concentrated toward specific age groups than the broader Lake Forest average, according to iHuus data.
Block-Level Insights for Lower Greenridge

iHuus Neighborhood Intelligence Insights
Get block-level neighborhood insights for Lower Greenridge
- Street-level scores — see how individual blocks compare, not just neighborhood averages
- Micro-zone boundaries — identify quiet pockets, flood boundaries, and walkable clusters before you visit
- 15 dimensions in full — walkability, noise, air quality, school quality, insurance coverage, population age profile, urban/rural index, and more
- Boundary risk alerts — know if your address sits near a block boundary where scores drop, the kind of detail no listing will ever mention
- School insights — individual school ratings and insights, not just district-level data
- Compare before you commit — side-by-side data across neighborhoods, down to block precision
No credit card required
Compare with Any Neighborhood
| Dimension | Lower Greenridge | Cedar Glen |
|---|---|---|
| 🚶 Walkabilityavg 9.06 | ||
| 🔊 Acoustic Comfortavg 2.35 | ||
| 🤫 Privacy Indexavg 4.92 | ||
| 🎨 Visual Appealavg 7.47 | ||
| 🐕 Dog Friendlinessavg 7.8 | ||
| 🗺️ Urban-Rural Indexavg 6.78 | ||
| ✨ Neighborhood Vibeavg 5.04 | ||
| 🏥 Health Insurance Coverageavg 8.09 | ||
| 🌿 Air Qualityavg 8 | ||
| 🏭 Industrial Proximityavg 8.61 | ||
| 🌊 Flood Safetyavg 5.49 | ||
| 🗳️ Ideological Leanavg 4.58 | ||
| 👥 Population Age Profileavg 5.17 | ||
| 🔥 Fire Safetyavg 0.44 | ||
| 🏫 School Quality |
Lower Greenridge Rankings
School Districts Serving Lower Greenridge
SVUSD is a high-performing, stable school district characterized by an elite collection of top-tier high schools and a diverse range of successful elementary programs, earning it a 'Solid/Stable' rating. While the district is managing a 2% decline in enrollment—a common demographic trend in South Orange County—its operational health remains strong due to successful facility modernizations, high graduation rates (95%), and a proactive expansion of specialized CTE and dual-language tracks. Although a small subset of intermediate and alternative schools shows lower performance metrics, the district's overall portfolio remains highly desirable, bolstered by significant community support and a reputation for excellence in both academics and special education services.
Schools
School Insights for Lower Greenridge
Below average outcomes; significant attendance and academic challenges.
School Insights
See what's really behind every school rating near Lower Greenridge
- Individual school ratings — each school's own score with outcome context, not just a district average
- Enrollment & class size data — student-to-teacher ratio and how it compares to the state average
- Full demographics breakdown — ethnicity and gender composition for every school in the enrollment zone
- Every school in the district — all schools within the enrollment boundary ranked by rating, not just the closest one
- Grade levels & benchmarks — elementary through high school, with below/above state-average flags
No credit card required