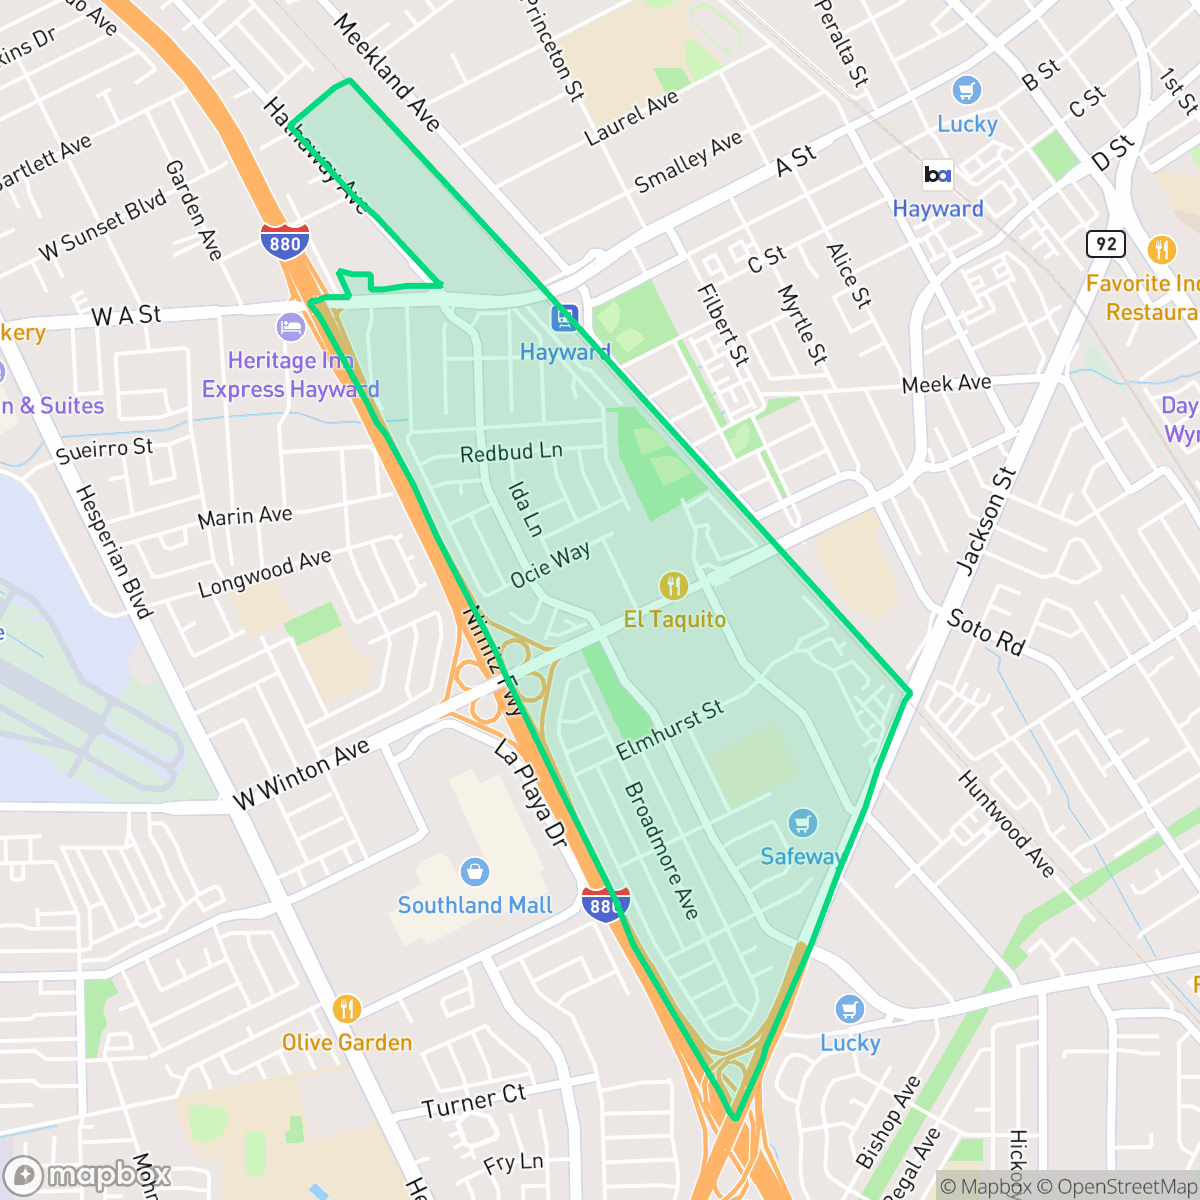
Santa Clara, Hayward
Updated June 22, 2026 · 8,096 residents
Santa Clara is a high-density suburban neighborhood in Hayward characterized by its exceptional walkability and proximity to diverse local dining options. Residents benefit from a robust network of sidewalks and nearby green spaces, though the area experiences notable noise levels due to its location near major transit corridors and industrial zones.
Key Highlights
About Santa Clara
Santa Clara is a dense, suburban community in Hayward that balances residential living with significant commercial and industrial activity. The area is defined by a mix of single-family homes and multi-unit complexes, creating a compact environment where daily errands are easily managed on foot. According to iHuus data, the neighborhood maintains a high level of walkability, supported by a comprehensive sidewalk network that connects residents to local social hubs and diverse restaurants.
Prospective residents should be aware of the trade-offs associated with this location. The neighborhood experiences elevated noise levels from nearby road traffic and rail lines, which may impact acoustic comfort. While the area offers convenient access to parks and community amenities, it faces challenges related to aging infrastructure and local school district performance. It is best suited for those who prioritize accessibility and a lively, urban-suburban atmosphere over quiet seclusion or expansive private outdoor space.
Neighborhood Scores Across 15 Qualities
Closely spaced housing and shared-wall structures result in lower privacy levels compared to the Hayward average. Residents may experience less distance between neighbors due to the high density of multi-family units and tightly clustered homes.
Sidewalks and crosswalks are widely available throughout residential and commercial zones, though a major highway and rail corridor interrupt the pedestrian network. According to iHuus data, the connectivity is slightly below the Hayward average due to these significant traffic arteries.
Standard tract housing and multi-family complexes dominate the landscape, featuring uniform rooflines and small yards. This area offers a consistent visual profile that is largely in line with the city average.
Accessible green spaces and community parks are available for pet owners, though opportunities for walking along wide sidewalk verges are below the Hayward average. Some residential streets feature narrow paths or primarily private yards, according to iHuus data.
Residential areas consist of a dense suburban landscape with a variety of single-family homes, apartment complexes, and commercial retail centers. This mix of building types is slightly more developed than the city average.
Diverse dining options and local social hubs provide more activity than the typical Hayward neighborhood, though the area remains primarily a calm, suburban landscape. While some blocks feel lively, many streets are car-dependent and characterized by a mix of green spaces and light industrial units.
Frequent noise from nearby railroad tracks and major freeways characterizes this area. According to iHuus data, acoustic comfort in Santa Clara is notably lower than the Hayward city average.
Air quality levels fluctuate between acceptable and unhealthy for sensitive groups; this remains largely consistent with the average for Hayward according to iHuus data.
Residential life is largely uninterrupted by heavy industry, though some large warehouses and truck loading zones are located near the western and southern edges. This concentration of commercial activity is lower than the Hayward city average according to iHuus data.
Health insurance access is widespread among residents in this area, sitting slightly above the Hayward city average according to iHuus data.
Voting patterns and census indicators reflect a highly liberal political leaning that aligns with the city average.
Residents live alongside a balanced mix of young adults, families, and older individuals. This demographic distribution is slightly more varied than the average found across Hayward.
Located in a coastal high-hazard zone with potential wave action, this area faces significantly higher flood risks than the Hayward average. According to iHuus data, residents should anticipate elevated or potentially prohibitive flood insurance costs.
Block-Level Insights for Santa Clara

iHuus Neighborhood Intelligence Insights
Get block-level neighborhood insights for Santa Clara
- Street-level scores — see how individual blocks compare, not just neighborhood averages
- Micro-zone boundaries — identify quiet pockets, flood boundaries, and walkable clusters before you visit
- 15 dimensions in full — walkability, noise, air quality, school quality, insurance coverage, population age profile, urban/rural index, and more
- Boundary risk alerts — know if your address sits near a block boundary where scores drop, the kind of detail no listing will ever mention
- School insights — individual school ratings and insights, not just district-level data
- Compare before you commit — side-by-side data across neighborhoods, down to block precision
No credit card required
Compare with Any Neighborhood
| Dimension | Santa Clara | Burbank |
|---|---|---|
| 🚶 Walkabilityavg 8.68 | ||
| 🔊 Acoustic Comfortavg 3.07 | ||
| 🤫 Privacy Indexavg 4.49 | ||
| 🎨 Visual Appealavg 6.11 | ||
| 🐕 Dog Friendlinessavg 6.49 | ||
| 🗺️ Urban-Rural Indexavg 6.69 | ||
| ✨ Neighborhood Vibeavg 4.15 | ||
| 🏥 Health Insurance Coverageavg 7.62 | ||
| 🌿 Air Qualityavg 5.88 | ||
| 🏭 Industrial Proximityavg 7.6 | ||
| 🌊 Flood Safetyavg 1.94 | ||
| 🗳️ Ideological Leanavg 9.75 | ||
| 👥 Population Age Profileavg 4.77 | ||
| 🔥 Fire Safetyavg 0.2 | ||
| 🏫 School Quality |
Santa Clara Rankings
School Districts Serving Santa Clara
Hayward Unified School District is currently in a distressed state, marked by a sharp academic divide and significant operational headwinds. While pockets of excellence exist in specialized programs like Dual Language Immersion and early literacy initiatives, nearly half of the district's schools are performing at the bottom tier of state metrics. The district faces a projected budget deficit driven by declining enrollment, leading to contentious 'School Transformation' plans that include potential closures and consolidations. Despite strong teacher commitment and improvements in school safety protocols, the combination of low-performing high schools, aging infrastructure, and fiscal instability prevents the district from achieving a stable middle-tier rating.
Schools
San Lorenzo Unified School District is currently in a distressed state characterized by declining enrollment and a stark portfolio of low-performing schools, particularly at the middle and high school levels. While the district maintains strong community diversity and successful Career Technical Education (CTE) pathways that provide vocational value, these are overshadowed by significant academic gaps where over half the schools are rated 3/10 or lower. Recent fiscal 'right-sizing' and reports of middle school safety issues further underscore institutional instability. Although bond-funded infrastructure improvements and stable labor relations offer some operational hope, the district's core academic metrics and demographic trends suggest a system struggling to maintain baseline consistency across its campuses.
Schools
School Insights for Santa Clara
Below average outcomes; significant attendance and academic challenges.
School Insights
See what's really behind every school rating near Santa Clara
- Individual school ratings — each school's own score with outcome context, not just a district average
- Enrollment & class size data — student-to-teacher ratio and how it compares to the state average
- Full demographics breakdown — ethnicity and gender composition for every school in the enrollment zone
- Every school in the district — all schools within the enrollment boundary ranked by rating, not just the closest one
- Grade levels & benchmarks — elementary through high school, with below/above state-average flags
No credit card required