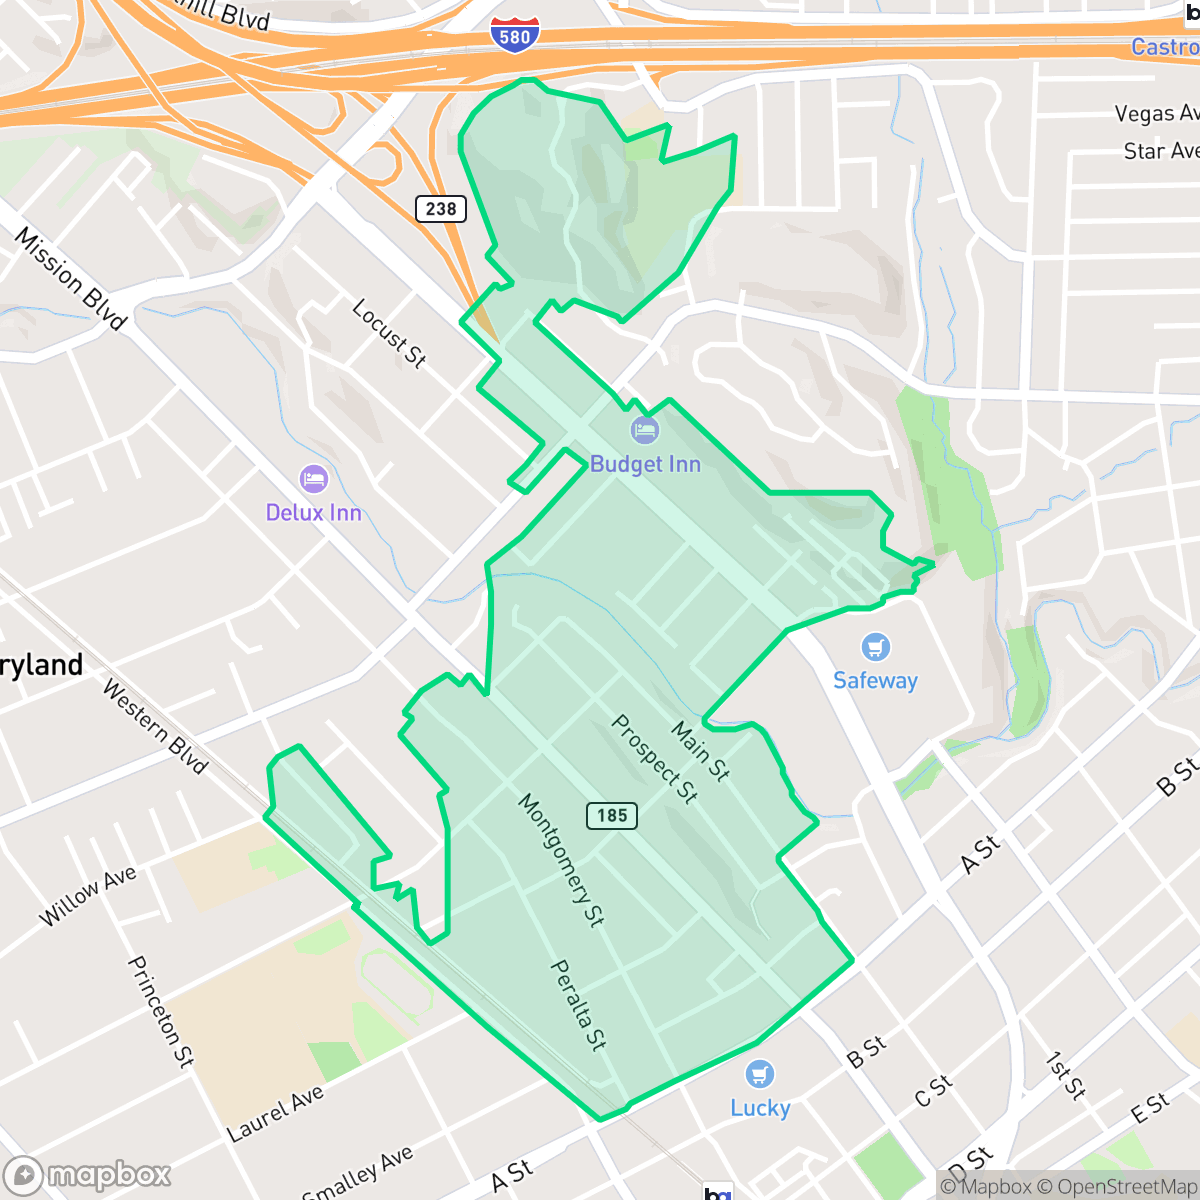
North Hayward, Hayward
Updated June 22, 2026 · 4,212 residents
North Hayward is a highly walkable neighborhood defined by its grid-based street layout and a blend of historic architecture and dense suburban housing. While it offers residents convenient access to local dining and social hubs, the area experiences significant road noise and limited privacy due to its close-knit residential density.
Key Highlights
About North Hayward
North Hayward, California, possesses a rich history shaped by its varied topography and early transit corridors. Mission Boulevard, which runs through the neighborhood, originally served as a Spanish exploration route and was later utilized as a trolley line connecting to the San Francisco ferry. The neighborhood’s architectural heritage is highly visible along Pearce Street, which retains its 19th-century character through narrow roadways, picket fences, and historic pioneer cottages. Nearby, the Montgomery Area showcases spacious Craftsman and California bungalows dating back to the 1920s. Rising above these historic flats, Prospect Hill features a diverse collection of custom, well-landscaped homes that offer scenic views of the city, the San Francisco Bay, and the surrounding hills.
The neighborhood functions as a dense suburban environment that prioritizes pedestrian connectivity. Residents benefit from a consistent sidewalk network and proximity to essential retail strips and local eateries, such as La Pinata and Great River Chinese Restaurant. Social activity centers around community landmarks like the Hayward Church of Christ, contributing to an active local atmosphere despite the prevalence of standard tract housing and high-density apartment complexes. Prospective residents should consider the trade-offs associated with living here, as the area faces challenges regarding acoustic comfort due to consistent road traffic. Additionally, the local school district currently struggles with fiscal instability and performance metrics, which may impact families. The neighborhood is best suited for those who prioritize walkability and proximity to transit corridors over quiet, secluded living or expansive private outdoor spaces.
Neighborhood Scores Across 15 Qualities
Residential spacing is mixed, featuring both multi-unit apartment blocks with shared walls and detached homes with typical suburban setbacks. According to iHuus data, the density in this area is slightly higher than the Hayward average.
Pedestrian movement is supported by a consistent sidewalk network and clear crosswalks at major intersections. While the area is slightly below the city average for walkability, the grid-like street pattern offers safe passage throughout most of the neighborhood.
Uniform tract housing and dense apartment complexes define the landscape, featuring consistent rooflines and small yards. This visual profile is largely in line with the rest of Hayward.
Public green space for pets is relatively sparse in this area, falling below the Hayward average. While a central wooded greenbelt and some school fields provide walking opportunities, most greenery is confined to private yards and narrow sidewalk verges.
Residential pockets consist of single-family homes and multi-unit apartments interspersed with commercial strips. This landscape offers a suburban feel that is slightly less open than the city average.
A variety of international dining options and social hubs provide more activity than the typical Hayward neighborhood. While many blocks offer a high-energy atmosphere, much of the area remains car-dependent due to the suburban layout.
Frequent traffic and transit sounds from nearby freeways and railroad lines contribute to a noisier environment than the Hayward average, according to iHuus data.
Air quality fluctuates between acceptable and unhealthy levels, presenting occasional concerns for sensitive groups. According to iHuus data, these conditions are roughly in line with the average found across Hayward.
Primarily residential in nature, this area features only light commercial activity and lacks the heavy industrial hazards found in other parts of the city. While a nearby railway corridor and large warehouses may contribute to some noise, the neighborhood avoids large scale manufacturing or heavy logistics hubs.
Health insurance accessibility is strong in this area, with coverage rates appearing notably higher than the Hayward average according to iHuus data.
Voting patterns and census indicators reflect a deeply liberal political leaning that is consistent with the rest of Hayward. This political alignment is a defining characteristic of the area according to iHuus data.
A balanced distribution of young adults, families, and seniors defines the local demographic. According to iHuus data, this age profile is very similar to the broader Hayward area.
Flood vulnerability is significantly higher than the Hayward average due to the area's location within a designated floodplain. Residents should anticipate a greater need for flood insurance and proactive property protection according to iHuus data.
Block-Level Insights for North Hayward

iHuus Neighborhood Intelligence Insights
Get block-level neighborhood insights for North Hayward
- Street-level scores — see how individual blocks compare, not just neighborhood averages
- Micro-zone boundaries — identify quiet pockets, flood boundaries, and walkable clusters before you visit
- 15 dimensions in full — walkability, noise, air quality, school quality, insurance coverage, population age profile, urban/rural index, and more
- Boundary risk alerts — know if your address sits near a block boundary where scores drop, the kind of detail no listing will ever mention
- School insights — individual school ratings and insights, not just district-level data
- Compare before you commit — side-by-side data across neighborhoods, down to block precision
No credit card required
Compare with Any Neighborhood
| Dimension | North Hayward | Burbank |
|---|---|---|
| 🚶 Walkabilityavg 8.68 | ||
| 🔊 Acoustic Comfortavg 3.07 | ||
| 🤫 Privacy Indexavg 4.49 | ||
| 🎨 Visual Appealavg 6.11 | ||
| 🐕 Dog Friendlinessavg 6.49 | ||
| 🗺️ Urban-Rural Indexavg 6.69 | ||
| ✨ Neighborhood Vibeavg 4.15 | ||
| 🏥 Health Insurance Coverageavg 7.62 | ||
| 🌿 Air Qualityavg 5.88 | ||
| 🏭 Industrial Proximityavg 7.6 | ||
| 🌊 Flood Safetyavg 1.94 | ||
| 🗳️ Ideological Leanavg 9.75 | ||
| 👥 Population Age Profileavg 4.77 | ||
| 🔥 Fire Safetyavg 0.2 | ||
| 🏫 School Quality |
North Hayward Rankings
School Districts Serving North Hayward
Hayward Unified School District is currently in a distressed state, marked by a sharp academic divide and significant operational headwinds. While pockets of excellence exist in specialized programs like Dual Language Immersion and early literacy initiatives, nearly half of the district's schools are performing at the bottom tier of state metrics. The district faces a projected budget deficit driven by declining enrollment, leading to contentious 'School Transformation' plans that include potential closures and consolidations. Despite strong teacher commitment and improvements in school safety protocols, the combination of low-performing high schools, aging infrastructure, and fiscal instability prevents the district from achieving a stable middle-tier rating.
Schools
School Insights for North Hayward
Below average outcomes; significant attendance and academic challenges.
School Insights
See what's really behind every school rating near North Hayward
- Individual school ratings — each school's own score with outcome context, not just a district average
- Enrollment & class size data — student-to-teacher ratio and how it compares to the state average
- Full demographics breakdown — ethnicity and gender composition for every school in the enrollment zone
- Every school in the district — all schools within the enrollment boundary ranked by rating, not just the closest one
- Grade levels & benchmarks — elementary through high school, with below/above state-average flags
No credit card required