Longwood-Winton Grove, Hayward
Updated June 22, 2026 · 4,394 residents
Longwood-Winton Grove is a dense, suburban neighborhood in Hayward defined by its post-war tract housing and proximity to major industrial corridors. While the area offers a grid-based layout with consistent sidewalks, residents experience significant noise from nearby highway traffic and the adjacent airport.
Key Highlights
About Longwood-Winton Grove
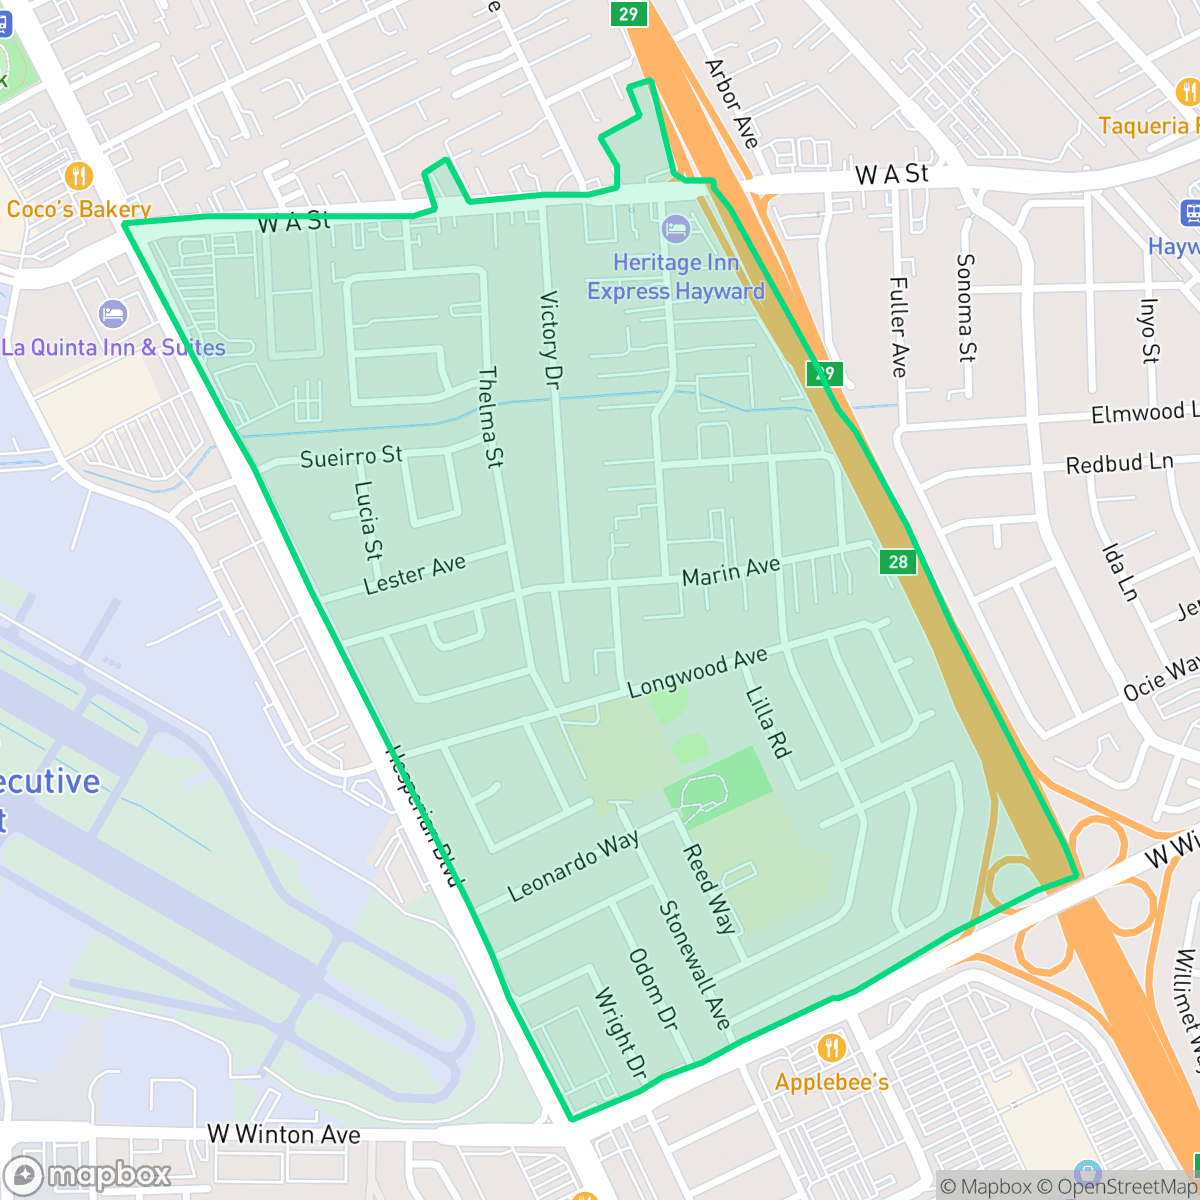
Prior to World War I, the Longwood-Winton Grove area of Hayward, California, was primarily used for agriculture. During the 1920s, portions of the neighborhood in the Happyland tract were subdivided into agricultural ranchettes, a historical pattern that remains visible today in the long, deep residential lots along South Garden Avenue. Victory Drive was developed during the early stages of World War II, while much of the remaining land was built out during the post-war subdivision boom. Consequently, more than 56% of the neighborhood's housing stock was constructed during the 1950s alone. Today, the neighborhood is bounded by Interstate 880, West 'A' Street, West Winton Avenue, and Hesperian Boulevard.
The area serves as a transit-adjacent residential zone characterized by its 1950s development pattern and high-density housing. It features a mix of single-family homes and multi-unit complexes, with a landscape that includes light industrial warehouses and commercial strips. The neighborhood maintains a functional, suburban atmosphere, though the presence of major thoroughfares like Interstate 880 and the Hayward Executive Airport creates a distinct urban environment that is heavily influenced by regional transportation infrastructure.
Prospective residents should consider the trade-offs regarding acoustic comfort and privacy, as the high-density layout and proximity to major roads result in elevated noise levels. While the neighborhood provides access to local dining and essential services, the overall livability is influenced by the surrounding industrial activity and the challenges facing local school districts. It is best suited for those prioritizing location and housing accessibility over quiet, secluded living.
Neighborhood Scores Across 15 Qualities
Residential structures are positioned in close proximity with minimal separation between homes. According to iHuus data, this lack of spacing results in a lower level of privacy than the typical Hayward neighborhood.
Sidewalks and crosswalks are generally available along residential streets, though a major highway divides part of the neighborhood and may impact pedestrian ease. While the area is navigable, walkability levels are slightly below the Hayward average due to these heavy traffic corridors.
Residential views consist of standard tract housing and multi-unit complexes with uniform rooflines and small yards. This landscape is typical for the area, aligning closely with the city average for visual variety.
Limited sidewalk verges and a reliance on private yards mean there are fewer casual walking options for pets compared to the rest of Hayward. While some residents can access nearby school fields and a large public park, the neighborhood overall lacks the widespread green street edges found elsewhere in the city.
The landscape consists of a dense suburban environment with various single-family homes, apartment complexes, and commercial retail centers. This level of development is slightly more built-up than the typical Hayward area.
A steady mix of light industrial units and residential streets creates a calm atmosphere that matches the city average for activity. While some dining and park options are available, the area remains largely car-dependent with sparse pedestrian-oriented commercial density.
Frequent aircraft noise from nearby runway proximity and heavy rail activity makes this area significantly louder than the Hayward average, according to iHuus data.
Air quality levels are generally acceptable, though sensitive groups may experience occasional concern on certain days. According to iHuus data, the local air quality is roughly in line with the average for Hayward.
Large warehouses and truck loading docks are prominent in the southern and northern portions of the area. This presence of light industrial activity and commercial traffic is more notable here than in many other parts of Hayward.
Health insurance access is notably lower than the Hayward average, according to iHuus data. This indicates a higher proportion of uninsured residents compared to most parts of the city.
Voting patterns and census indicators reflect a deeply liberal political leaning that is consistent with the rest of Hayward. According to iHuus data, this area shares the same ideological profile as the city average.
A balanced variety of young adults, families, and older residents characterizes the area, reflecting a demographic profile similar to the rest of Hayward.
Significant flood risk exists here because parts of the area are located within a designated floodplain. According to iHuus data, this level of risk is higher than the average for Hayward.
Block-Level Insights for Longwood-Winton Grove

iHuus Neighborhood Intelligence Insights
Get block-level neighborhood insights for Longwood-Winton Grove
- Street-level scores — see how individual blocks compare, not just neighborhood averages
- Micro-zone boundaries — identify quiet pockets, flood boundaries, and walkable clusters before you visit
- 15 dimensions in full — walkability, noise, air quality, school quality, insurance coverage, population age profile, urban/rural index, and more
- Boundary risk alerts — know if your address sits near a block boundary where scores drop, the kind of detail no listing will ever mention
- School insights — individual school ratings and insights, not just district-level data
- Compare before you commit — side-by-side data across neighborhoods, down to block precision
No credit card required
Compare with Any Neighborhood
| Dimension | Longwood-Winton Grove | Burbank |
|---|---|---|
| 🚶 Walkabilityavg 8.68 | ||
| 🔊 Acoustic Comfortavg 3.07 | ||
| 🤫 Privacy Indexavg 4.49 | ||
| 🎨 Visual Appealavg 6.11 | ||
| 🐕 Dog Friendlinessavg 6.49 | ||
| 🗺️ Urban-Rural Indexavg 6.69 | ||
| ✨ Neighborhood Vibeavg 4.15 | ||
| 🏥 Health Insurance Coverageavg 7.62 | ||
| 🌿 Air Qualityavg 5.88 | ||
| 🏭 Industrial Proximityavg 7.6 | ||
| 🌊 Flood Safetyavg 1.94 | ||
| 🗳️ Ideological Leanavg 9.75 | ||
| 👥 Population Age Profileavg 4.77 | ||
| 🔥 Fire Safetyavg 0.2 | ||
| 🏫 School Quality |
Longwood-Winton Grove Rankings
School Districts Serving Longwood-Winton Grove
Hayward Unified School District is currently in a distressed state, marked by a sharp academic divide and significant operational headwinds. While pockets of excellence exist in specialized programs like Dual Language Immersion and early literacy initiatives, nearly half of the district's schools are performing at the bottom tier of state metrics. The district faces a projected budget deficit driven by declining enrollment, leading to contentious 'School Transformation' plans that include potential closures and consolidations. Despite strong teacher commitment and improvements in school safety protocols, the combination of low-performing high schools, aging infrastructure, and fiscal instability prevents the district from achieving a stable middle-tier rating.
Schools
San Lorenzo Unified School District is currently in a distressed state characterized by declining enrollment and a stark portfolio of low-performing schools, particularly at the middle and high school levels. While the district maintains strong community diversity and successful Career Technical Education (CTE) pathways that provide vocational value, these are overshadowed by significant academic gaps where over half the schools are rated 3/10 or lower. Recent fiscal 'right-sizing' and reports of middle school safety issues further underscore institutional instability. Although bond-funded infrastructure improvements and stable labor relations offer some operational hope, the district's core academic metrics and demographic trends suggest a system struggling to maintain baseline consistency across its campuses.
Schools
School Insights for Longwood-Winton Grove
Below average outcomes; significant attendance and academic challenges.
School Insights
See what's really behind every school rating near Longwood-Winton Grove
- Individual school ratings — each school's own score with outcome context, not just a district average
- Enrollment & class size data — student-to-teacher ratio and how it compares to the state average
- Full demographics breakdown — ethnicity and gender composition for every school in the enrollment zone
- Every school in the district — all schools within the enrollment boundary ranked by rating, not just the closest one
- Grade levels & benchmarks — elementary through high school, with below/above state-average flags
No credit card required