Fairway Park, Hayward
Updated June 22, 2026 · 7,661 residents
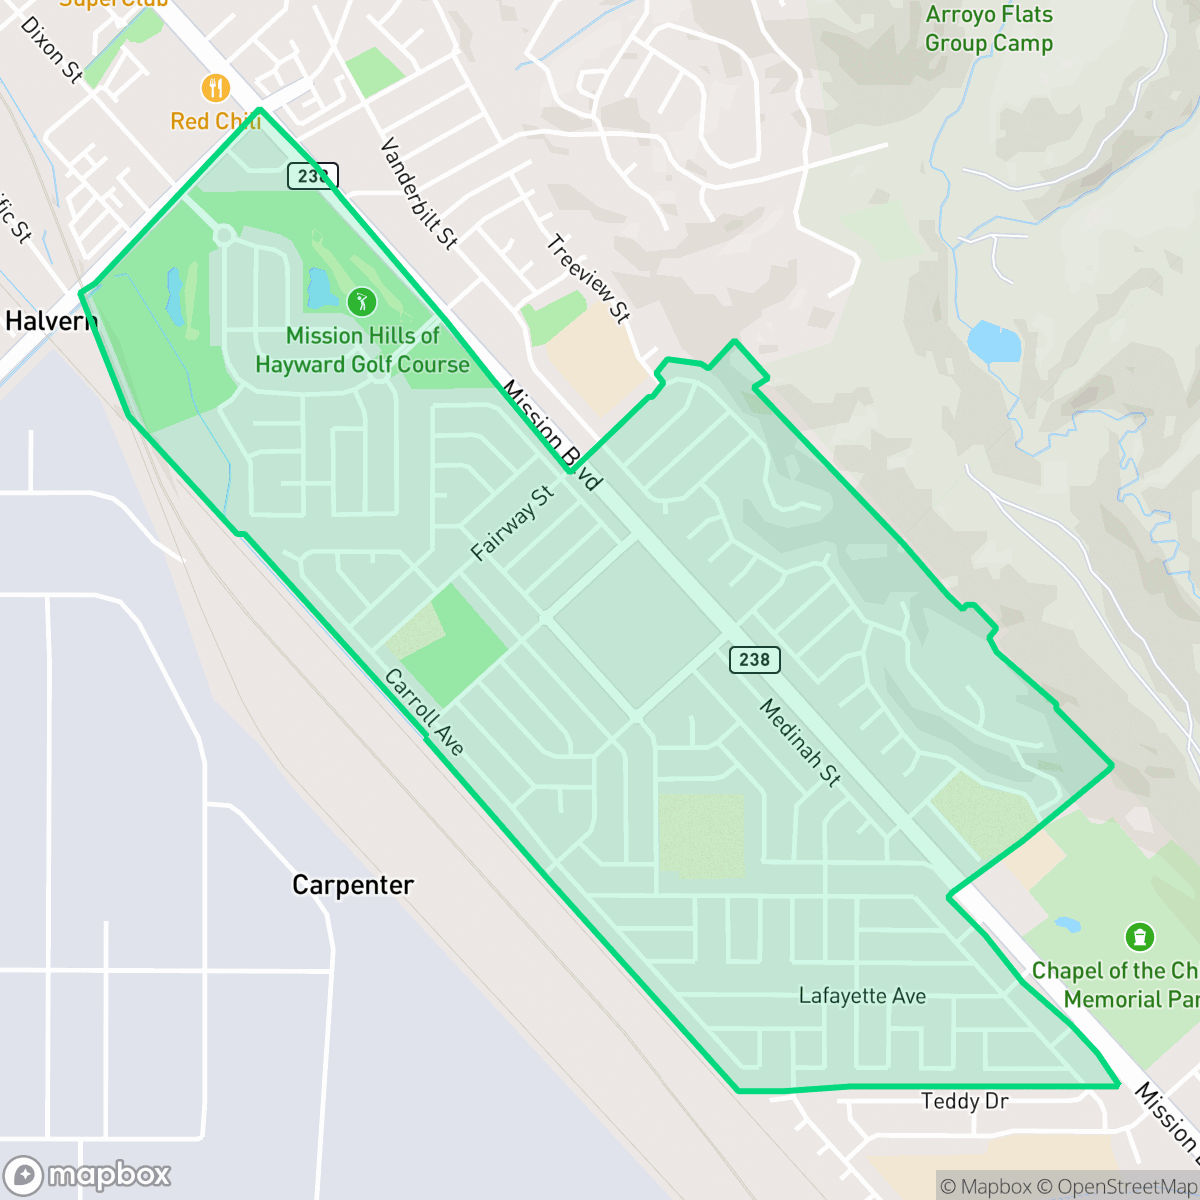
Fairway Park is a dense residential community in southeastern Hayward known for its exceptional walkability and proximity to expansive green spaces like Garin Regional Park. While the area offers convenient access to local parks for pet owners, residents should expect a quiet suburban environment that faces notable noise from road traffic and proximity to western industrial zones.
Key Highlights
About Fairway Park
Located in southeastern Hayward, California, the Fairway Park neighborhood is a residential community bounded by Industrial Parkway, the BART tracks, and Garin Regional Park. The neighborhood's name derives from the former Hayward Golf Course, which operated in the area from the early 1950s until 1986. Developed primarily during the post-World War II suburban boom, approximately 76% of Fairway Park's housing stock—dominated by single-family homes—was built during the 1950s alone. Today, the neighborhood is characterized by its proximity to the scenic trails of Garin Regional Park and local green spaces like Fairway Greens Park and Bidwell Park. Culturally, the area is defined by its rich diversity, featuring a prominent Asian-American community with a notable concentration of Tagalog speakers.
The area maintains a consistent suburban character defined by its 1950s tract housing and high-density layout. According to iHuus data, the neighborhood achieves a perfect walkability score due to its continuous sidewalk network and accessible pedestrian crossings. Residents benefit from significant green space access, including local parks and school fields that cater to outdoor activities and dog owners.
Prospective residents should consider the trade-offs of this location, particularly regarding acoustic comfort and housing privacy. Homes are situated close together with minimal setbacks, and the average noise level is elevated primarily by road traffic. While the neighborhood provides a stable residential environment with strong health insurance coverage, it is situated near industrial warehouses and rail lines, which may impact the overall atmosphere for those seeking a more secluded or tranquil setting.
Neighborhood Scores Across 15 Qualities
Residential spacing is largely consistent with the Hayward average, featuring a mix of closely packed houses and apartment buildings with shared walls. Some areas within the neighborhood experience high density with very small setbacks between structures.
Continuous sidewalk networks and clear pedestrian crossings make navigating the area on foot easy. This level of walkability is roughly in line with the Hayward city average, according to iHuus data.
Modern homes with complex architecture and private pools provide a more polished aesthetic than the Hayward average. According to iHuus data, the neighborhood features notable golf course adjacency and spacious residential lots.
Extensive greenways, a central golf course, and wide grassy verges provide ample space for walking dogs. According to iHuus data, this neighborhood offers significantly more accessible parkland and safe walking paths than the Hayward average.
Open lands and scattered homes provide a semi-rural character that is consistent with the Hayward average. This layout blends residential pockets with nearby fields and woodland areas according to iHuus data.
Low density residential spaces and industrial corridors create a tranquil environment, but local amenities and social destinations are significantly less frequent than in the rest of Hayward. Residents will find a peaceful landscape characterized by parks and greenery, though much of the area relies on driving to access essential businesses and dining.
Frequent noise from nearby railroad tracks and heavy freeway traffic characterizes this area. Acoustic comfort is slightly below the Hayward city average according to iHuus data.
Air quality in Fairway Park fluctuates between acceptable and unhealthy levels, appearing slightly lower than the average for Hayward. Sensitive groups should monitor local conditions during periods of poor visibility or stagnation.
Industrial presence is minimal throughout the area, with much of the neighborhood consisting of quiet residential and recreational spaces. While some western edges border logistics hubs and rail corridors, the overall density of heavy warehousing is slightly lower than the Hayward average.
Health insurance accessibility is notably higher than the Hayward average, according to iHuus data. Most residents in this area have access to comprehensive medical coverage.
Voting patterns and census indicators reflect a deeply liberal political landscape, consistent with the broader Hayward area according to iHuus data.
Residents live alongside a diverse mix of young adults, families, and older individuals. This demographic distribution is consistent with the average seen across Hayward.
Properties in this area are situated within a known floodplain, which may necessitate the purchase of flood insurance. According to iHuus data, the risk level in Fairway Park is slightly higher than the average for Hayward.
High levels of fire hazard characterize this area, presenting a risk that is slightly higher than the Hayward average. According to iHuus data, residents should be aware of the extreme precautions necessary for this location.
Block-Level Insights for Fairway Park

iHuus Neighborhood Intelligence Insights
Get block-level neighborhood insights for Fairway Park
- Street-level scores — see how individual blocks compare, not just neighborhood averages
- Micro-zone boundaries — identify quiet pockets, flood boundaries, and walkable clusters before you visit
- 15 dimensions in full — walkability, noise, air quality, school quality, insurance coverage, population age profile, urban/rural index, and more
- Boundary risk alerts — know if your address sits near a block boundary where scores drop, the kind of detail no listing will ever mention
- School insights — individual school ratings and insights, not just district-level data
- Compare before you commit — side-by-side data across neighborhoods, down to block precision
No credit card required
Compare with Any Neighborhood
| Dimension | Fairway Park | Burbank |
|---|---|---|
| 🚶 Walkabilityavg 8.68 | ||
| 🔊 Acoustic Comfortavg 3.07 | ||
| 🤫 Privacy Indexavg 4.49 | ||
| 🎨 Visual Appealavg 6.11 | ||
| 🐕 Dog Friendlinessavg 6.49 | ||
| 🗺️ Urban-Rural Indexavg 6.69 | ||
| ✨ Neighborhood Vibeavg 4.15 | ||
| 🏥 Health Insurance Coverageavg 7.62 | ||
| 🌿 Air Qualityavg 5.88 | ||
| 🏭 Industrial Proximityavg 7.6 | ||
| 🌊 Flood Safetyavg 1.94 | ||
| 🗳️ Ideological Leanavg 9.75 | ||
| 👥 Population Age Profileavg 4.77 | ||
| 🔥 Fire Safetyavg 0.2 | ||
| 🏫 School Quality |
Fairway Park Rankings
School Districts Serving Fairway Park
New Haven Unified School District presents a tale of two districts, characterized by elite-level academic performance in its elementary schools and national-caliber extracurricular programs at James Logan High, contrasted against significant financial and operational instability. While state testing data consistently exceeds averages, the district is currently grappling with the 'Distressed' symptoms of declining enrollment, budget deficits, and polarizing campus safety concerns at the secondary level. The operational health is categorized as 'Mixed'—it maintains a 'Blue Chip' reputation for its high-achieving student body and specialized STEAM programs, yet it faces the immediate reality of potential school closures and administrative consolidation to remain solvent.
Schools
Hayward Unified School District is currently in a distressed state, marked by a sharp academic divide and significant operational headwinds. While pockets of excellence exist in specialized programs like Dual Language Immersion and early literacy initiatives, nearly half of the district's schools are performing at the bottom tier of state metrics. The district faces a projected budget deficit driven by declining enrollment, leading to contentious 'School Transformation' plans that include potential closures and consolidations. Despite strong teacher commitment and improvements in school safety protocols, the combination of low-performing high schools, aging infrastructure, and fiscal instability prevents the district from achieving a stable middle-tier rating.
Schools
School Insights for Fairway Park
Below average outcomes; significant attendance and academic challenges.
School Insights
See what's really behind every school rating near Fairway Park
- Individual school ratings — each school's own score with outcome context, not just a district average
- Enrollment & class size data — student-to-teacher ratio and how it compares to the state average
- Full demographics breakdown — ethnicity and gender composition for every school in the enrollment zone
- Every school in the district — all schools within the enrollment boundary ranked by rating, not just the closest one
- Grade levels & benchmarks — elementary through high school, with below/above state-average flags
No credit card required