Mission San Jose, Fremont
Updated · 7,199 residents
Mission San Jose is a highly walkable community characterized by its affluent, well-manicured residential streets and proximity to expansive green corridors. While the area offers a serene, low-density suburban atmosphere, residents should be aware of consistent road traffic noise and the potential for wildfire risks.
Key Highlights
About Mission San Jose
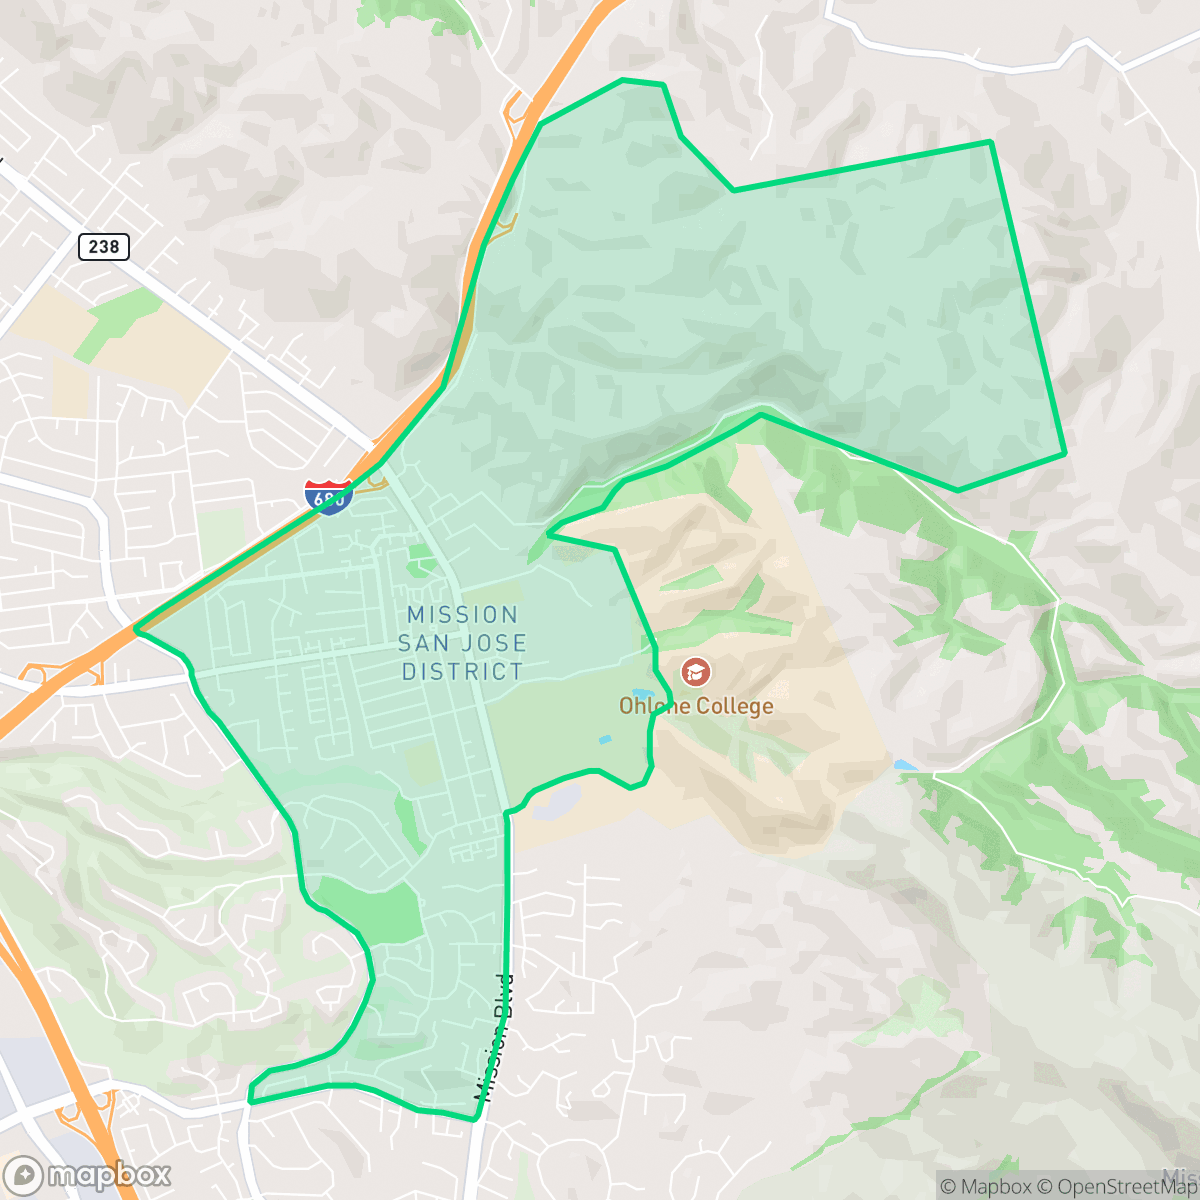
Named after the Spanish mission founded in 1797 by Father Fermín Lasuén, Mission San Jose is a historic neighborhood in southern Fremont and one of the five original townships that incorporated to form the city in 1956. Originally inhabited by the Ohlone people, the area served as a prosperous agricultural hub during the mission era and a bustling supply stop during the 1848 Gold Rush. The neighborhood’s cultural and architectural anchor is the Old Mission San José, featuring a meticulously reconstructed 1809 adobe church completed in 1985 and a surviving 1809 convento. Other notable local landmarks include the historic Ohlone Cemetery, the Jose de Jesus Vallejo Adobe, and the Mission Coffee Roasting Company, which operates out of a former 19th-century stagecoach stop.
The neighborhood serves as a quiet, residential enclave defined by its high walkability and strong commitment to education. With consistent sidewalks and significant green spaces, it provides an accessible environment for pedestrians and pet owners alike. The area is anchored by top-tier academic institutions, including the highly-rated Mission San Jose Elementary, which remains a primary draw for families seeking stability and high-quality instruction. According to iHuus data, the community benefits from exceptional health insurance coverage and a cohesive ideological environment, maintaining a peaceful, suburban character that prioritizes privacy and aesthetic appeal.
Living here involves specific trade-offs, particularly regarding environmental and acoustic factors. The neighborhood experiences consistent road traffic noise, which averages 62 decibels, contributing to a lower acoustic comfort score. Prospective residents should also note the elevated wildfire risk and lack of flood safety, which are important considerations for property maintenance and insurance. While the area offers a serene lifestyle with excellent access to local history and nature, the overall pace is relatively slow, with limited commercial activity and a car-oriented focus for most daily errands beyond walking to local parks or schools.
Neighborhood Scores Across 15 Qualities
Typical suburban spacing provides a reasonable buffer between homes, offering more privacy than the average Fremont neighborhood. Larger lots near greenbelts contribute to a sense of separation between neighbors according to iHuus data.
Wide sidewalks and ample pedestrian crossings are consistently available on both residential and arterial roads. This area offers a level of walkability that is very similar to the rest of Fremont.
Large homes with manicured landscaping and private pools define the streetscape, offering a higher level of visual polish than the Fremont average. According to iHuus data, the area is characterized by spacious properties and well-maintained amenities.
Abundant green corridors and wooded park areas offer extensive space for walking dogs. According to iHuus data, the availability of trails and open spaces in this area is significantly higher than the Fremont average.
Expansive rolling hills and significant undeveloped green space provide a more open, natural feel than most of Fremont. Residents can expect a landscape defined by vast grasslands and scattered structures rather than dense urban development.
Low density and significant open space create a tranquil environment, though the area lacks the commercial activity and social energy found in more active parts of Fremont. Most residents will find the neighborhood highly peaceful, but local services and businesses are sparse and primarily require a car for access.
Frequent noise from nearby railroad tracks and heavy freeway traffic is common in this area. According to iHuus data, acoustic comfort levels are slightly lower than the Fremont city average.
Air quality levels are slightly better than the Fremont average, though residents may encounter occasional periods of concern during certain weather conditions. Sensitive groups should monitor local reports for days when pollutants are more prevalent.
Industrial presence is virtually nonexistent here, offering a landscape of quiet streets and green spaces that is notably cleaner than the Fremont average. Aside from minor utility and water management infrastructure, the area is free from warehouses or industrial hazards according to iHuus data.
Health insurance enrollment is exceptionally high among residents, remaining well above the Fremont city average according to iHuus data.
Voting patterns and census indicators reflect a predominantly liberal political leaning, consistent with the broader Fremont area according to iHuus data.
Residents live in a community with a diverse age distribution, featuring a balanced mix of young adults, families, and seniors. This demographic spread is slightly more varied than the typical profile found across Fremont.
Significant flood hazards exist here due to coastal wave action, which represents a much higher risk than the Fremont average. Residents should prepare for potentially elevated or prohibitive flood insurance costs according to iHuus data.
Extreme fire hazards are present in this area, representing a significantly higher risk level than the rest of Fremont. Residents should prioritize maximum protection measures according to iHuus data.
Address-Level Insights for Mission San Jose


iHuus Neighborhood Intelligence Insights
Get address-level neighborhood insights for Mission San Jose
- Street-level scores — see how individual blocks compare, not just neighborhood averages
- Micro-zone boundaries — identify quiet pockets, flood boundaries, and walkable clusters before you visit
- 15 dimensions in full — walkability, noise, air quality, school quality, insurance coverage, population age profile, urban/rural index, and more
- Boundary risk alerts — know if your address sits near a block boundary where scores drop, the kind of detail no listing will ever mention
- School insights — individual school ratings and insights, not just district-level data
- Compare before you commit — side-by-side data across neighborhoods, down to block precision
No credit card required
Compare with Any Neighborhood
| Dimension | Mission San Jose | 28 Palms |
|---|---|---|
| 🚶 Walkabilityavg 9.3 | ||
| 🔊 Acoustic Comfortavg 3.38 | ||
| 🤫 Privacy Indexavg 5.09 | ||
| 🎨 Visual Appealavg 6.63 | ||
| 🐕 Dog Friendlinessavg 7.76 | ||
| 🗺️ Urban-Rural Indexavg 6.78 | ||
| ✨ Neighborhood Vibeavg 4.75 | ||
| 🏥 Health Insurance Coverageavg 8.99 | ||
| 🌿 Air Qualityavg 5.76 | ||
| 🏭 Industrial Proximityavg 8.97 | ||
| 🌊 Flood Safetyavg 3.62 | ||
| 🗳️ Ideological Leanavg 9.57 | ||
| 👥 Population Age Profileavg 4.91 | ||
| 🔥 Fire Safetyavg 0.2 | ||
| 🏫 School Quality |
Mission San Jose Rankings
School Districts Serving Mission San Jose
School Insights for Mission San Jose
Below average outcomes; significant attendance and academic challenges.
School Insights
See what's really behind every school rating near Mission San Jose
- Individual school ratings — each school's own score with outcome context, not just a district average
- Enrollment & class size data — student-to-teacher ratio and how it compares to the state average
- Full demographics breakdown — ethnicity and gender composition for every school in the enrollment zone
- Every school in the district — all schools within the enrollment boundary ranked by rating, not just the closest one
- Grade levels & benchmarks — elementary through high school, with below/above state-average flags
No credit card required