East Industrial, Fremont
Updated June 22, 2026 · 6,002 residents
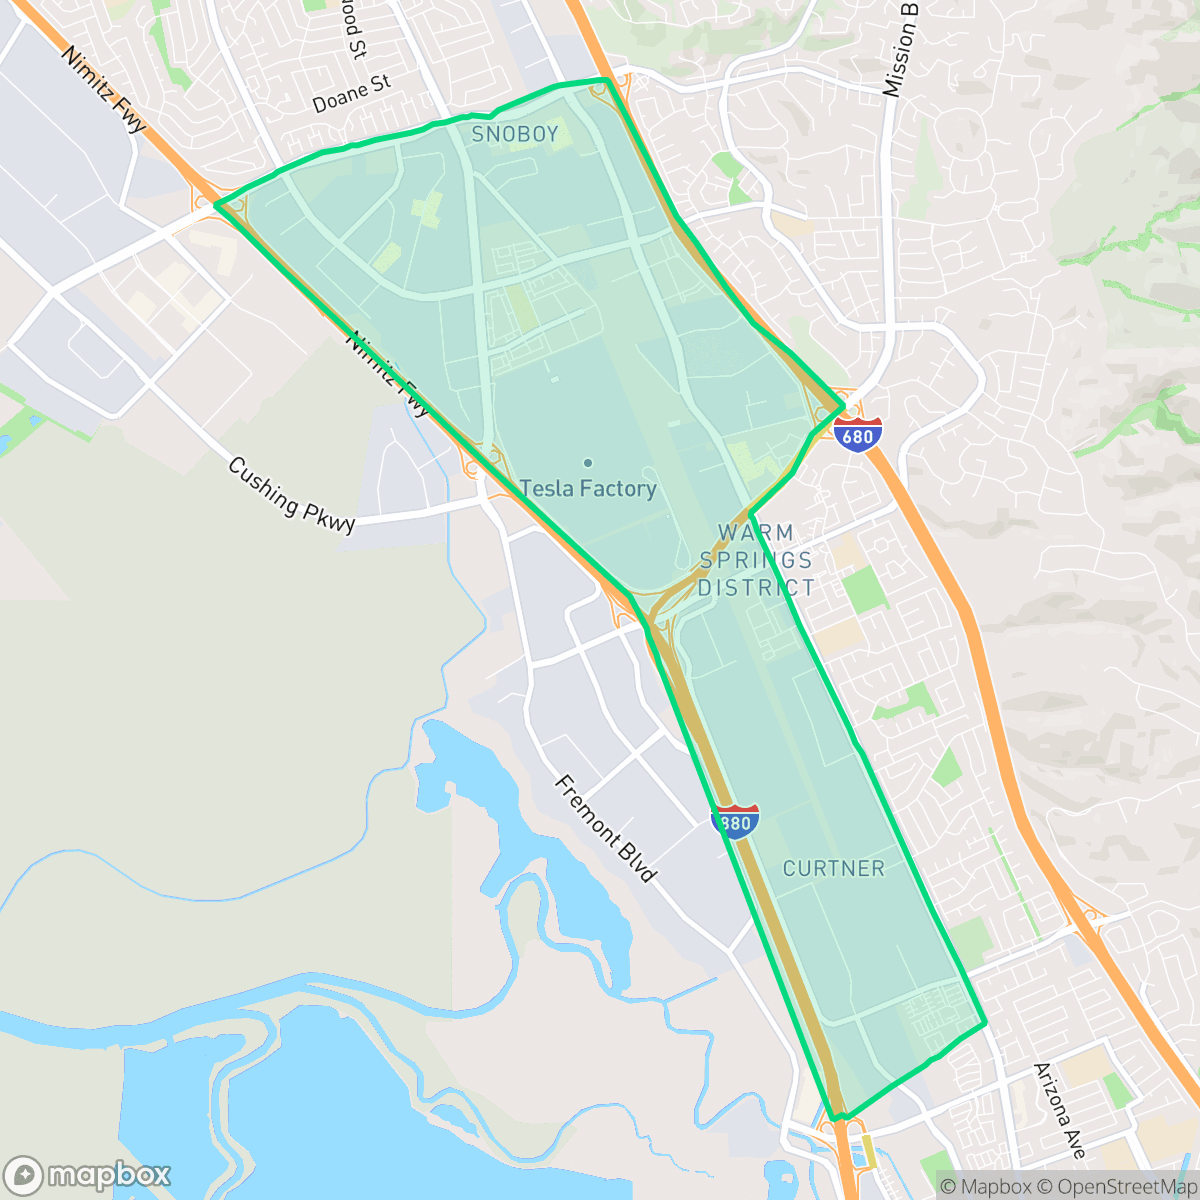
East Industrial is a distinct Fremont neighborhood defined by its dense mix of large-scale manufacturing plants, logistics warehouses, and residential tracts. While the area offers proximity to major transit corridors, residents experience significant noise from constant road traffic and a car-dependent environment.
Key Highlights
About East Industrial
East Industrial serves as a functional hub for Fremont's manufacturing and logistics sectors, housing significant industrial infrastructure alongside residential pockets. The landscape is dominated by large-footprint warehouses, freight corridors, and multi-family housing, creating a utilitarian environment that prioritizes industrial utility over aesthetic appeal. The area functions as a transition zone where active commercial daytime traffic meets suburban residential living.
Living in this area requires navigating a high-traffic environment, as the neighborhood is heavily influenced by proximity to major highways and active commercial zones. It is best suited for individuals who prioritize proximity to employment centers and transit access over quiet, walkable streets. Prospective residents should note the high ambient noise levels and the industrial nature of the surroundings when considering the area for long-term housing.
Neighborhood Scores Across 15 Qualities
Residential spacing is varied, with some areas featuring closely positioned homes and shared walls. This level of density is slightly higher than the Fremont average, according to iHuus data.
Marked crosswalks and sidewalk networks connect residential areas to nearby commercial zones. While much of the neighborhood is easily navigable on foot, walkability is slightly lower than the Fremont average.
Uniform tract housing and mobile home parks characterize the landscape, which offers slightly less visual variety than the Fremont average. Residential lots typically feature modest yards and standardized architectural styles.
Small community parks and continuous sidewalk verges provide decent walking space for pets, though amenities are below the Fremont city average. Accessible grass fields and green spaces are available for dog owners within the area.
Vast warehouse footprints and extensive paved surfaces characterize this area, creating an environment slightly more developed than the Fremont average. Large-scale manufacturing plants and significant grey infrastructure dominate the landscape compared to more open, semi-rural surroundings.
A mix of warehouses and freight corridors creates a subdued atmosphere with limited social activity. While some local dining and essential services exist, the area is notably less lively than the Fremont average due to its heavy reliance on vehicles.
Frequent disturbances from nearby railroad tracks and heavy freeway traffic characterize this area. According to iHuus data, acoustic comfort in this neighborhood is significantly lower than the Fremont average.
Air quality in this area fluctuates between acceptable and unhealthy levels, appearing slightly lower than the Fremont average. Sensitive groups should remain aware of occasional periods of concern according to iHuus data.
Extensive logistics hubs, large-scale manufacturing, and heavy freight traffic are prominent features of this area. According to iHuus data, the concentration of warehouses and semi-truck activity is notably higher than the Fremont average.
Health insurance accessibility is very high among residents, staying slightly above the Fremont average according to iHuus data.
Voting patterns and census indicators show a highly liberal political leaning that is very similar to the broader Fremont area, according to iHuus data.
Residents live alongside a balanced mix of young adults, families, and older individuals. This demographic spread is largely consistent with the broader Fremont area, according to iHuus data.
Property located within a designated flood zone face significant risks of inundation. According to iHuus data, this area is more prone to flooding than the Fremont average, and flood insurance is typically a requirement for residents.
Block-Level Insights for East Industrial

iHuus Neighborhood Intelligence Insights
Get block-level neighborhood insights for East Industrial
- Street-level scores — see how individual blocks compare, not just neighborhood averages
- Micro-zone boundaries — identify quiet pockets, flood boundaries, and walkable clusters before you visit
- 15 dimensions in full — walkability, noise, air quality, school quality, insurance coverage, population age profile, urban/rural index, and more
- Boundary risk alerts — know if your address sits near a block boundary where scores drop, the kind of detail no listing will ever mention
- School insights — individual school ratings and insights, not just district-level data
- Compare before you commit — side-by-side data across neighborhoods, down to block precision
No credit card required
Compare with Any Neighborhood
| Dimension | East Industrial | 28 Palms |
|---|---|---|
| 🚶 Walkabilityavg 9.3 | ||
| 🔊 Acoustic Comfortavg 3.38 | ||
| 🤫 Privacy Indexavg 5.09 | ||
| 🎨 Visual Appealavg 6.63 | ||
| 🐕 Dog Friendlinessavg 7.76 | ||
| 🗺️ Urban-Rural Indexavg 6.78 | ||
| ✨ Neighborhood Vibeavg 4.75 | ||
| 🏥 Health Insurance Coverageavg 8.99 | ||
| 🌿 Air Qualityavg 5.76 | ||
| 🏭 Industrial Proximityavg 8.97 | ||
| 🌊 Flood Safetyavg 3.62 | ||
| 🗳️ Ideological Leanavg 9.57 | ||
| 👥 Population Age Profileavg 4.91 | ||
| 🔥 Fire Safetyavg 0.2 | ||
| 🏫 School Quality |
East Industrial Rankings
School Districts Serving East Industrial
Milpitas Unified School District is a high-performing 'Blue Chip' organization characterized by exceptional academic results, a forward-thinking leadership team, and strong community financial support. With the majority of its schools achieving 9/10 or 10/10 ratings and a terminal high school that serves as a regional benchmark, MUSD maintains a stable and prestigious standing. The district is aggressively modernizing through its Innovation Campus and AI-integrated curriculum, while successfully managing labor relations through ratified pay raises. Despite minor performance gaps in two specialized schools and typical urban safety challenges, MUSD offers a rare combination of elite academic success and a balanced, collaborative culture that distinguishes it from its more high-stress Silicon Valley peers.
Schools
Fremont Unified School District is a high-performing academic powerhouse characterized by exceptional state testing scores, low chronic absenteeism, and a portfolio dominated by 10/10 rated schools. While the district maintains elite status in college readiness and teacher quality, it is currently navigating a significant $24.7 million budget reduction for the 2026-2027 cycle to ensure long-term solvency. Community sentiment reflects a high-pressure environment supported by strong parental involvement, and while facilities at some older campuses are maturing, the district remains a premier choice for families due to its consistent delivery of top-tier educational outcomes and stable institutional leadership.
Schools
School Insights for East Industrial
Below average outcomes; significant attendance and academic challenges.
School Insights
See what's really behind every school rating near East Industrial
- Individual school ratings — each school's own score with outcome context, not just a district average
- Enrollment & class size data — student-to-teacher ratio and how it compares to the state average
- Full demographics breakdown — ethnicity and gender composition for every school in the enrollment zone
- Every school in the district — all schools within the enrollment boundary ranked by rating, not just the closest one
- Grade levels & benchmarks — elementary through high school, with below/above state-average flags
No credit card required