Southwest Industrial Park, Fontana
Updated June 22, 2026 · 9,906 residents
Southwest Industrial Park is a logistics-focused district in Fontana defined by its extensive network of massive distribution centers and adjacent high-density residential tracts. While the area offers proximity to major transit corridors, it remains a car-dependent environment characterized by limited public green space and frequent heavy vehicle traffic.
Key Highlights
About Southwest Industrial Park
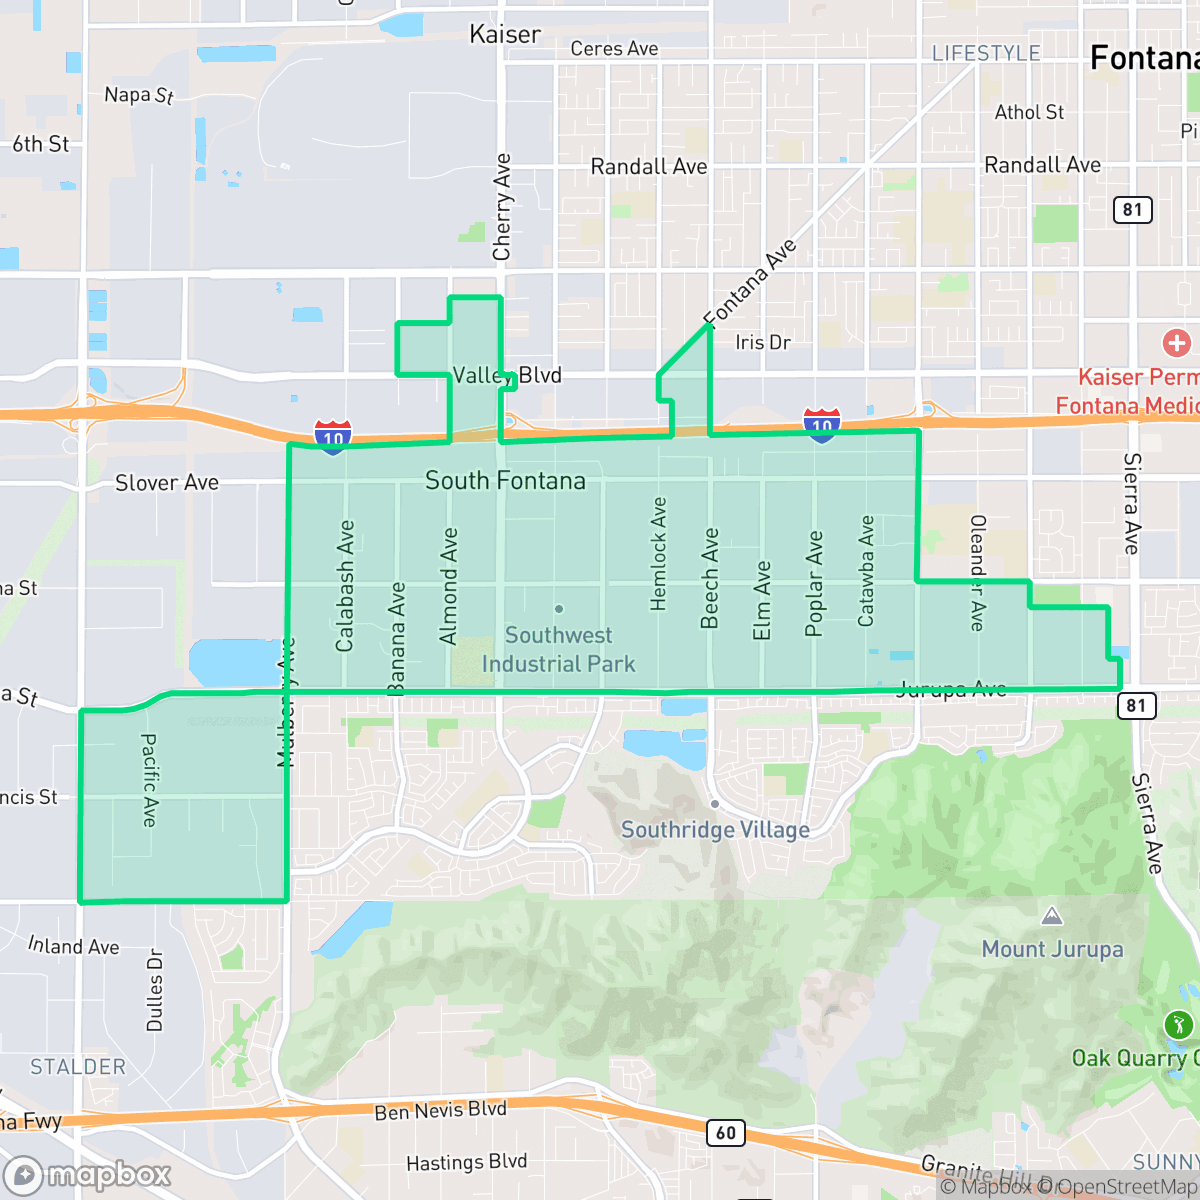
The Southwest Industrial Park (SWIP) in Fontana, California, originated as a targeted redevelopment zone. The SWIP Redevelopment Project was first adopted in July 1977 to eliminate blight and stimulate private investment south of Interstate 10. To guide its physical transformation, the city established the SWIP Specific Plan on December 6, 1983, which originally covered approximately 1,800 acres. Over subsequent decades, the area underwent massive expansion and multiple annexations of unincorporated San Bernardino County land, growing to over 3,100 acres. This planning effort successfully transitioned the district from scattered, non-conforming county parcels into a major regional hub for the logistics, warehousing, and transportation industries, characterized by large-scale modern distribution centers, trucking facilities, and industrial manufacturing.
The neighborhood serves as a critical node in the regional logistics chain, where sprawling warehouse facilities and paved logistics yards dominate the landscape. Residential pockets consist primarily of dense, uniform tract housing that sit in close proximity to major freight corridors. According to iHuus data, the area experiences significant industrial activity, with heavy truck traffic and loading dock operations serving as constant features of the local environment.
Residents in the area face notable trade-offs, particularly regarding daily walkability and access to recreational amenities. The neighborhood lacks expansive public parks or wide green buffers, which limits options for outdoor exercise or pet owners. While the area maintains decent air quality despite the heavy industrial presence, the high density of housing and the proximity to large-scale logistics operations mean that privacy is often limited. Prospective residents should consider the car-dependent nature of the district and the necessity of commuting for most commercial and social services.
Neighborhood Scores Across 15 Qualities
Residential structures feature mixed spacing with some neighbors situated closely together. According to iHuus data, the level of separation between homes is slightly below the Fontana city average.
Sidewalks are available on many streets and provide safe crossings, though high truck traffic on industrial arterials can make some areas difficult to navigate. This level of pedestrian accessibility is slightly below the Fontana average, according to iHuus data.
Standard tract housing characterizes the area with repetitive rooflines and small, uniform yards. According to iHuus data, the visual variety in this neighborhood is lower than the Fontana average.
Walking paths and utility easements offer some space for pets, but overall access to public parks is slightly below the Fontana average. Most greenery is contained within private yards or narrow sidewalk verges rather than expansive dedicated dog parks.
Large-scale warehouses and logistics infrastructure dominate the landscape alongside pockets of residential tract housing. This industrial-heavy layout results in a landscape that is slightly more urbanized than the city average for Fontana.
Limited local businesses and dining options make this a primarily car-dependent area. The landscape is notably more subdued and industrial than the Fontana average, offering a quiet environment with very few walkable destinations.
Local traffic from nearby busy streets creates a consistent level of noise. This acoustic environment is slightly more active than the average found across Fontana.
Air quality is generally good with only rare instances of elevated readings, according to iHuus data. The air quality in this area is better than the average for Fontana.
Heavy logistics operations and frequent semi-truck traffic characterize this area, resulting in much higher levels of industrial presence than the Fontana average. Massive warehouse hubs and docking bays dominate the landscape, which may impact local noise and traffic patterns for nearby residents.
Health insurance coverage among residents is notably higher than the Fontana average, according to iHuus data.
Voting patterns and census indicators show a strong liberal leaning that is slightly more pronounced than the Fontana city average, according to iHuus data.
A diverse range of age groups including young adults, families, and seniors resides in this area. This demographic distribution is largely in line with the city average, according to iHuus data.
Properties are situated within a 100-year floodplain, which represents a higher risk level than the typical area in Fontana. According to iHuus data, residents should anticipate that flood insurance will likely be a requirement for local structures.
Extreme fire hazards are present in this area, representing a significantly higher risk level than the Fontana average according to iHuus data.
Block-Level Insights for Southwest Industrial Park

iHuus Neighborhood Intelligence Insights
Get block-level neighborhood insights for Southwest Industrial Park
- Street-level scores — see how individual blocks compare, not just neighborhood averages
- Micro-zone boundaries — identify quiet pockets, flood boundaries, and walkable clusters before you visit
- 15 dimensions in full — walkability, noise, air quality, school quality, insurance coverage, population age profile, urban/rural index, and more
- Boundary risk alerts — know if your address sits near a block boundary where scores drop, the kind of detail no listing will ever mention
- School insights — individual school ratings and insights, not just district-level data
- Compare before you commit — side-by-side data across neighborhoods, down to block precision
No credit card required
Compare with Any Neighborhood
| Dimension | Southwest Industrial Park | Citrus Heights |
|---|---|---|
| 🚶 Walkabilityavg 7.84 | ||
| 🔊 Acoustic Comfortavg 4.52 | ||
| 🤫 Privacy Indexavg 4.77 | ||
| 🎨 Visual Appealavg 6.2 | ||
| 🐕 Dog Friendlinessavg 5.44 | ||
| 🗺️ Urban-Rural Indexavg 6.65 | ||
| ✨ Neighborhood Vibeavg 4.01 | ||
| 🏥 Health Insurance Coverageavg 6.25 | ||
| 🌿 Air Qualityavg 6.56 | ||
| 🏭 Industrial Proximityavg 6.85 | ||
| 🌊 Flood Safetyavg 1.02 | ||
| 🗳️ Ideological Leanavg 8.61 | ||
| 👥 Population Age Profileavg 4.4 | ||
| 🔥 Fire Safetyavg 0.29 | ||
| 🏫 School Quality |
Southwest Industrial Park Rankings
School Districts Serving Southwest Industrial Park
Chaffey Joint Union High School District is a solid and stable high-performing organization, currently ranked as the premier district in San Bernardino County. With a portfolio of high schools that largely range from 6/10 to 9/10, the district demonstrates consistent academic success, particularly in English Language Arts and college readiness. While math proficiency remains a strategic area for growth and anecdotal reports suggest minor social-environment concerns on campus, the district's proactive leadership, diverse extracurricular offerings, and strong financial footing—highlighted by recent facility upgrades and successful community engagement initiatives—solidify its status as a top-tier educational provider.
Schools
Fontana Unified School District is a large, operationally active organization in transition, characterized by a significant performance gap between its premier academies and its struggling neighborhood schools. While the district earns high marks for its specialized Career Technical Education (CTE), dual immersion programs, and robust extracurriculars, it is hindered by low standardized test scores in middle school math and high staff turnover in special education. Recent investments in technology, campus security, and facility modernizations indicate a proactive administration and stable funding, yet the wide variance in school-level ratings (ranging from 1/10 to 10/10) prevents a higher overall designation, making it a 'Mixed/Transition' district.
Schools
Jurupa Unified School District functions as a stable, well-funded 'Community School' model district that struggles with deep-seated academic proficiency gaps, particularly at the middle school level where all sites are underperforming. While state testing scores in math and English are significantly below par, the district compensates with exceptional graduation rates (94.1%), award-winning CTE programs, and strong community trust as evidenced by successful bond measures and grant acquisitions. The district operates with high organizational stability and a clear strategic focus on student wellness and safety, making it a solid '3'—a district in transition that provides a safe and supportive environment despite lagging behind in core academic metrics.
Schools
Colton Joint Unified School District is currently in a distressed state characterized by a sharp academic divide and significant performance gaps in its middle and elementary schools. While flagship institutions like Grand Terrace High School offer high graduation rates and specialized CTE pathways, the district-wide proficiency in core subjects remains critically low, and several schools are operating with 1/10 ratings. Operational health is hampered by aging infrastructure and community concerns over safety and administrative transparency, though efforts to modernize the bus fleet and maintain student engagement in extracurriculars provide a minor buffer against complete institutional decline.
Schools
Cucamonga Elementary School District is a distressed district characterized by significantly below-average academic proficiency and persistent operational challenges. Despite the district's commendable efforts in providing community support services and managing a diverse student population, ground truth metrics reveal a sharp decline in academic standing, with math and reading scores trailing state averages by nearly 50%. While safety measures and community programs remain active, the district's low school ratings (as low as 2/10), high chronic absenteeism, and the lack of top-performing schools indicate an organization struggling to meet state standards and retain community confidence when compared to neighboring high-performing districts.
Schools
School Insights for Southwest Industrial Park
Below average outcomes; significant attendance and academic challenges.
School Insights
See what's really behind every school rating near Southwest Industrial Park
- Individual school ratings — each school's own score with outcome context, not just a district average
- Enrollment & class size data — student-to-teacher ratio and how it compares to the state average
- Full demographics breakdown — ethnicity and gender composition for every school in the enrollment zone
- Every school in the district — all schools within the enrollment boundary ranked by rating, not just the closest one
- Grade levels & benchmarks — elementary through high school, with below/above state-average flags
No credit card required