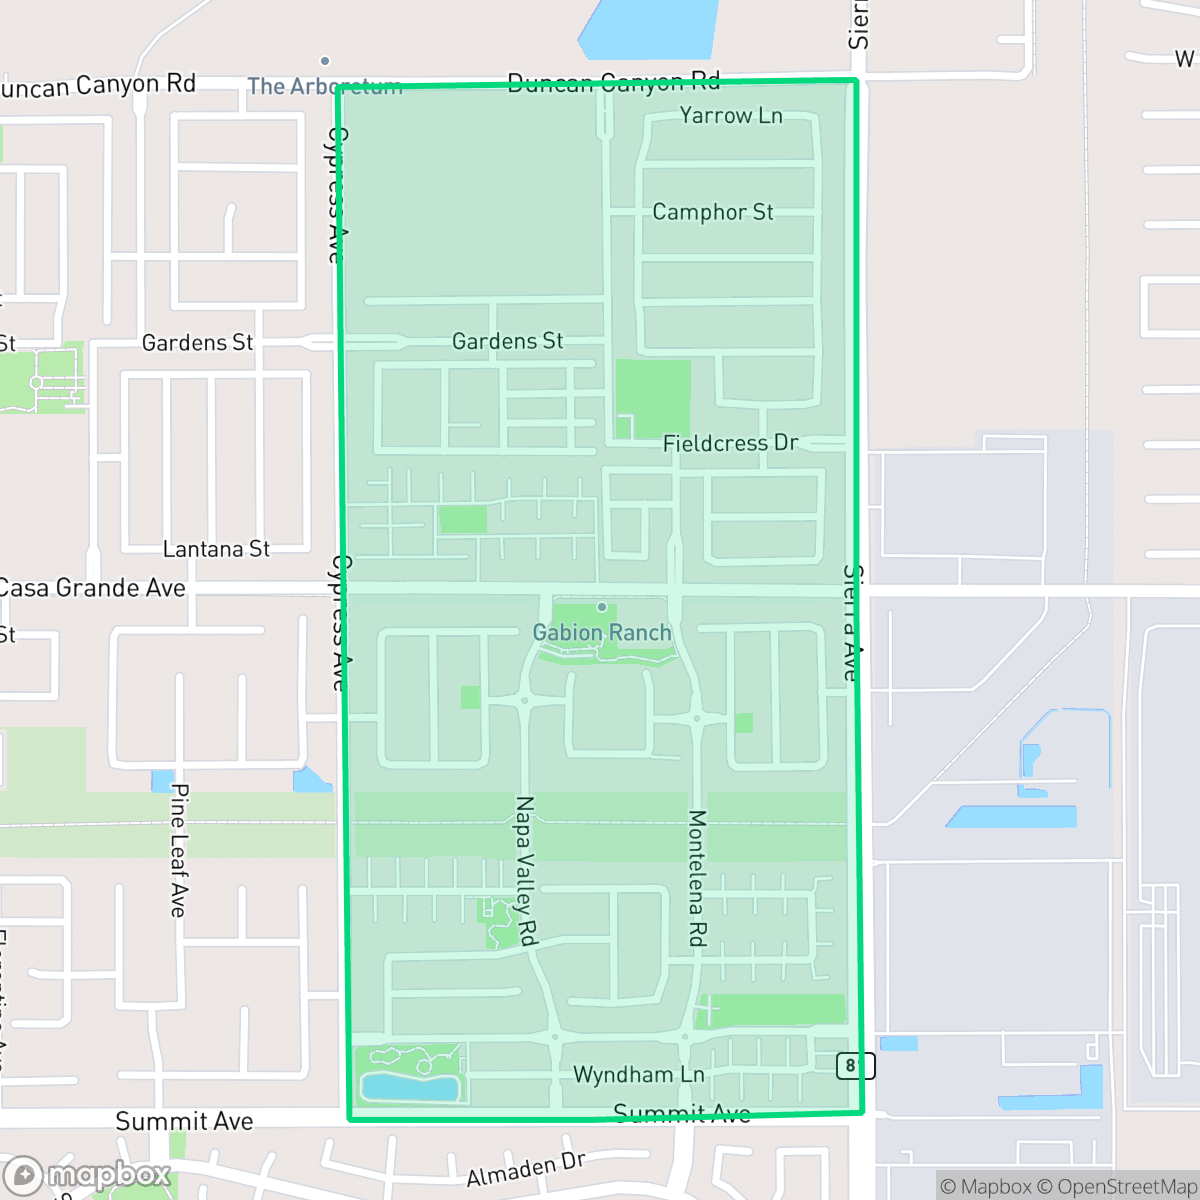
Gabion Ranch, Fontana
Updated June 22, 2026 · 538 residents
Gabion Ranch is a densely developed suburban neighborhood in Fontana characterized by high walkability and close proximity to large-scale logistics warehouses. Residents experience significant noise from road traffic and face challenges regarding air quality and privacy due to the area's industrial integration.
Key Highlights
About Gabion Ranch
Gabion Ranch is defined by its uniform housing tracts situated directly alongside massive logistics facilities. This layout creates an environment where residential life is tightly coupled with heavy commercial activity. While the neighborhood boasts an exceptionally high walkability score, the daily experience is heavily impacted by consistent road traffic noise and industrial proximity, which influence the overall acoustic environment and air quality. The area serves as a hub for those working in or near the logistics sector, though it presents a unique set of environmental conditions that distinguish it from traditional residential zones. The neighborhood presents distinct trade-offs for prospective residents. While the high level of walkability is a standout feature, the lack of privacy between homes and the environmental concerns stemming from nearby industrial operations are significant considerations. It is best suited for individuals who prioritize accessibility and proximity to major logistics corridors over quiet suburban living or expansive outdoor amenities.
Neighborhood Scores Across 15 Qualities
Residential spacing offers a moderate level of separation between neighbors, providing slightly more seclusion than the Fontana average.
Pedestrian movement is easy due to ample crossings and wide sidewalks on both sides of the street. This area offers significantly better walkability than the Fontana average, according to iHuus data.
Large homes and frequent upscale amenities create an aesthetically pleasing environment. According to iHuus data, the visual quality of this area is notably higher than the Fontana average.
Integrated green spaces and wide, traffic-separated paths make this an ideal area for pet owners. According to iHuus data, the level of dog friendliness here is significantly higher than the Fontana average.
Frequent open land and scattered homes provide a semi-rural feel that is very similar to the wider Fontana area. Some sections of the neighborhood feature dense suburban development positioned near large-scale industrial warehouses and logistics infrastructure.
Low-density industrial and warehouse corridors create a serene, low-activity environment that lacks significant commercial character. According to iHuus data, this area is notably less lively than the Fontana average, offering a quiet setting that relies heavily on vehicle travel for access to amenities.
Frequent noise from nearby railroad tracks and freeway traffic characterizes this area. According to iHuus data, acoustic conditions here are significantly more disruptive than the Fontana city average.
Air quality in this area fluctuates between acceptable and unhealthy levels. According to iHuus data, conditions are slightly lower than the Fontana city average, which may cause occasional concern for sensitive groups.
Residential life is largely uninterrupted by heavy industry, though some areas are adjacent to large logistics warehouses with significant truck traffic. According to iHuus data, the area is comparable to the rest of Fontana in terms of industrial presence, though residents should be aware of a nearby Superfund site.
Health insurance coverage is relatively high in this area, sitting above the Fontana city average according to iHuus data.
Political leanings in this area lean liberal, though the community is slightly less progressive than the broader Fontana average according to iHuus data.
Residents live alongside a balanced distribution of young adults, families, and older individuals. This demographic variety is largely in line with the broader Fontana area.
Flood safety in this area is significantly higher than the Fontana average, though some residual risk exists within the 500-year floodplain according to iHuus data.
Extreme fire hazards are present in this area, which is slightly higher than the average for Fontana. Residents should be prepared for significant wildfire risks and ensure all necessary safety precautions are in place.
Block-Level Insights for Gabion Ranch

iHuus Neighborhood Intelligence Insights
Get block-level neighborhood insights for Gabion Ranch
- Street-level scores — see how individual blocks compare, not just neighborhood averages
- Micro-zone boundaries — identify quiet pockets, flood boundaries, and walkable clusters before you visit
- 15 dimensions in full — walkability, noise, air quality, school quality, insurance coverage, population age profile, urban/rural index, and more
- Boundary risk alerts — know if your address sits near a block boundary where scores drop, the kind of detail no listing will ever mention
- School insights — individual school ratings and insights, not just district-level data
- Compare before you commit — side-by-side data across neighborhoods, down to block precision
No credit card required
Compare with Any Neighborhood
| Dimension | Gabion Ranch | Citrus Heights |
|---|---|---|
| 🚶 Walkabilityavg 7.84 | ||
| 🔊 Acoustic Comfortavg 4.52 | ||
| 🤫 Privacy Indexavg 4.77 | ||
| 🎨 Visual Appealavg 6.2 | ||
| 🐕 Dog Friendlinessavg 5.44 | ||
| 🗺️ Urban-Rural Indexavg 6.65 | ||
| ✨ Neighborhood Vibeavg 4.01 | ||
| 🏥 Health Insurance Coverageavg 6.25 | ||
| 🌿 Air Qualityavg 6.56 | ||
| 🏭 Industrial Proximityavg 6.85 | ||
| 🌊 Flood Safetyavg 1.02 | ||
| 🗳️ Ideological Leanavg 8.61 | ||
| 👥 Population Age Profileavg 4.4 | ||
| 🔥 Fire Safetyavg 0.29 | ||
| 🏫 School Quality |
Gabion Ranch Rankings
School Districts Serving Gabion Ranch
Fontana Unified School District is a large, operationally active organization in transition, characterized by a significant performance gap between its premier academies and its struggling neighborhood schools. While the district earns high marks for its specialized Career Technical Education (CTE), dual immersion programs, and robust extracurriculars, it is hindered by low standardized test scores in middle school math and high staff turnover in special education. Recent investments in technology, campus security, and facility modernizations indicate a proactive administration and stable funding, yet the wide variance in school-level ratings (ranging from 1/10 to 10/10) prevents a higher overall designation, making it a 'Mixed/Transition' district.
Schools
Rialto Unified School District operates as a stable but struggling 'Mixed' organization characterized by high graduation rates and strong extracurricular programs contrasted against critically low state testing proficiency. While the district maintains strong community loyalty and has taken aggressive steps to modernize campus security and parent communication following recent safety incidents, it suffers from a significant internal achievement gap where nearly one-third of its schools are underperforming (3/10 or lower). Its financial and operational standing is bolstered by successful teacher retention and award-winning induction programs, yet it remains in a transitional phase as it attempts to balance campus safety mandates with the need to improve core academic outcomes.
Schools
School Insights for Gabion Ranch
Below average outcomes; significant attendance and academic challenges.
School Insights
See what's really behind every school rating near Gabion Ranch
- Individual school ratings — each school's own score with outcome context, not just a district average
- Enrollment & class size data — student-to-teacher ratio and how it compares to the state average
- Full demographics breakdown — ethnicity and gender composition for every school in the enrollment zone
- Every school in the district — all schools within the enrollment boundary ranked by rating, not just the closest one
- Grade levels & benchmarks — elementary through high school, with below/above state-average flags
No credit card required