River East, El Monte
Updated · 12,713 residents
River East is a dense, industrial-suburban neighborhood in El Monte characterized by its proximity to major logistics hubs and highway corridors. While it offers a variety of local dining options, the area is largely car-dependent and features tightly packed residential structures with limited private outdoor space.
Key Highlights
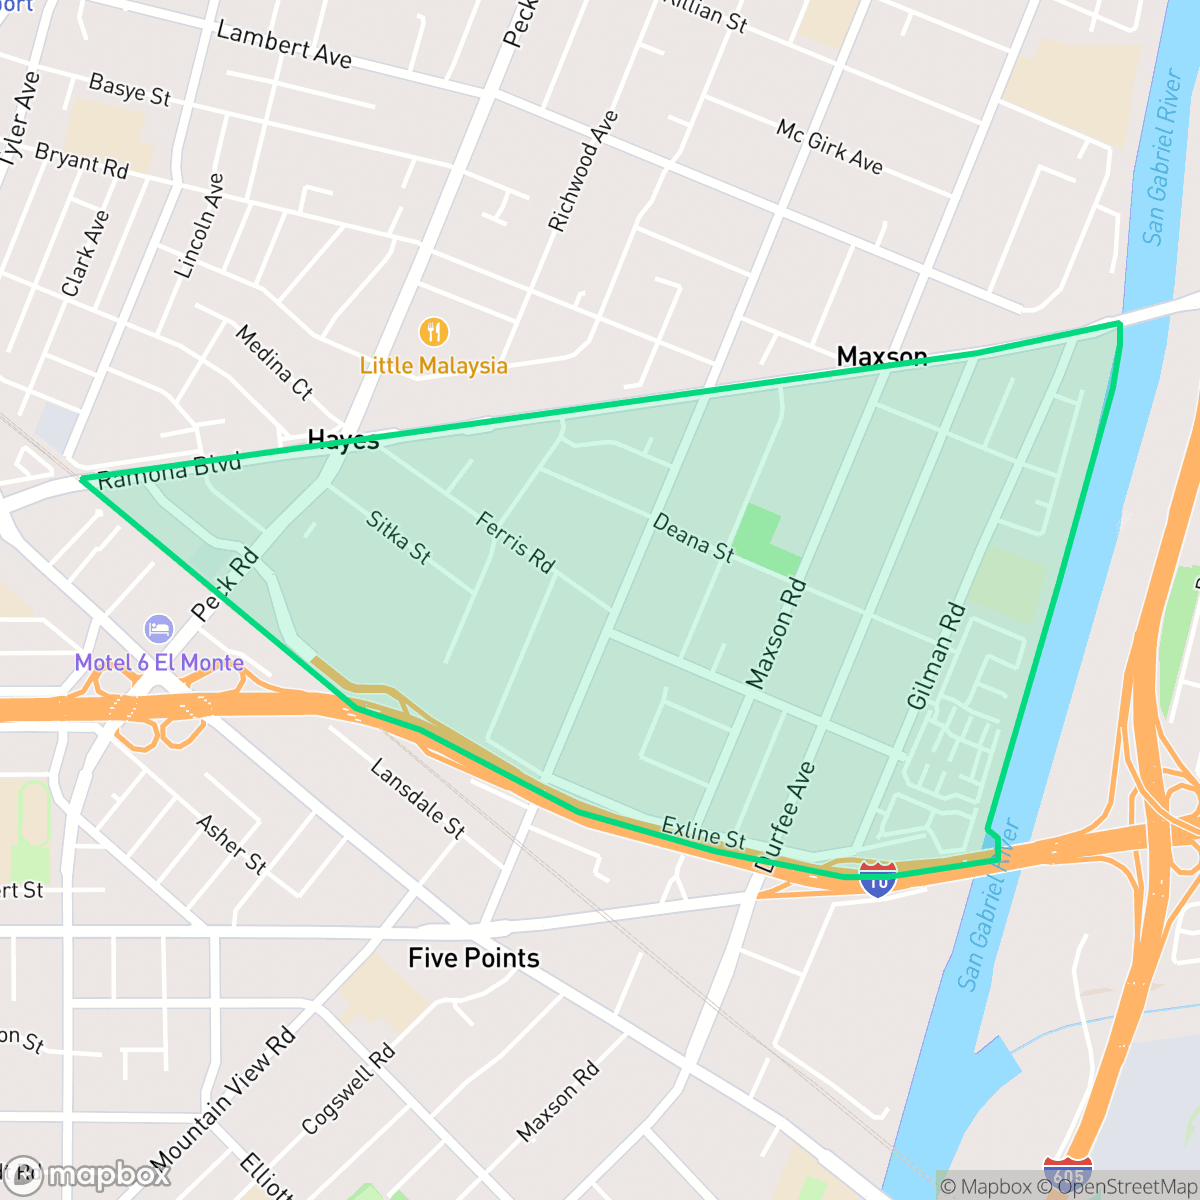
About River East
River East functions as a high-density, industrial-suburban enclave defined by its proximity to major freeway corridors and extensive logistics infrastructure. The landscape consists of a mix of standard tract housing and multi-family complexes, often situated near commercial centers and large concrete channels. According to iHuus data, the area maintains a distinct industrial character, with warehouses and freight corridors contributing to a steady level of ambient road noise throughout the day.
Prospective residents should note that the neighborhood is primarily car-oriented, as large highway intersections and heavy traffic patterns can limit pedestrian access despite a consistent grid of sidewalks. While the area provides diverse local dining opportunities and proximity to regional transit routes, it offers limited green space and minimal privacy due to the close proximity of neighboring structures. The district is best suited for those who prioritize accessibility to major logistics routes and regional commercial hubs over quiet, low-density living.
Neighborhood Scores Across 15 Qualities
Residential structures are closely packed with minimal separation between homes and many shared walls. This density is notably higher than the El Monte average, as many houses and apartment complexes feature very small gaps between buildings.
Sidewalks and crosswalks are available on most streets, but a major freeway and high-traffic arterials create significant barriers for pedestrians. This level of connectivity is lower than the El Monte city average due to these highway obstructions.
Standard tract housing and multi-unit complexes dominate the landscape, featuring uniform rooflines and limited private yard space. This level of visual variety is roughly in line with the rest of El Monte.
Limited public parks and narrow sidewalks with minimal green verges make much of the area less ideal for dog walking. According to iHuus data, the availability of accessible green space for pets is below the El Monte average.
Residential streets and green spaces exist in roughly equal measure. This area presents a suburban landscape that is slightly less dense than the average for El Monte.
Diverse dining options and local social hubs provide a more active atmosphere than the rest of El Monte. While certain pockets offer variety, the surrounding industrial landscape and highway proximity make much of the area car dependent.
Constant noise from the nearby freeway and railroad tracks makes this area louder than the El Monte average. According to iHuus data, residents should expect significant acoustic disruption due to these transit corridors.
Air quality in this area is generally healthy with infrequent periods of poor air. This level of cleanliness is nearly consistent with the El Monte average, according to iHuus data.
Occasional warehouses and truck bays are present, particularly along the southern edges near the freeway corridor. This level of industrial activity is slightly higher than the El Monte average, though the area remains primarily residential.
Health insurance access in this area is slightly below the El Monte average, according to iHuus data.
Voting patterns and census indicators show a predominantly liberal leaning that is slightly more pronounced than the El Monte average, according to iHuus data.
Residents live alongside a balanced mix of young adults, families, and older community members. This demographic distribution is consistent with the broader El Monte area, according to iHuus data.
Address-Level Insights for River East


iHuus Neighborhood Intelligence Insights
Get address-level neighborhood insights for River East
- Street-level scores — see how individual blocks compare, not just neighborhood averages
- Micro-zone boundaries — identify quiet pockets, flood boundaries, and walkable clusters before you visit
- 15 dimensions in full — walkability, noise, air quality, school quality, insurance coverage, population age profile, urban/rural index, and more
- Boundary risk alerts — know if your address sits near a block boundary where scores drop, the kind of detail no listing will ever mention
- School insights — individual school ratings and insights, not just district-level data
- Compare before you commit — side-by-side data across neighborhoods, down to block precision
No credit card required
Compare with Any Neighborhood
| Dimension | River East | Downtown |
|---|---|---|
| 🚶 Walkabilityavg 7.89 | ||
| 🔊 Acoustic Comfortavg 3.54 | ||
| 🤫 Privacy Indexavg 3.89 | ||
| 🎨 Visual Appealavg 5.51 | ||
| 🐕 Dog Friendlinessavg 4.38 | ||
| 🗺️ Urban-Rural Indexavg 6.21 | ||
| ✨ Neighborhood Vibeavg 4.71 | ||
| 🏥 Health Insurance Coverageavg 5.11 | ||
| 🌿 Air Qualityavg 8.12 | ||
| 🏭 Industrial Proximityavg 6.02 | ||
| 🌊 Flood Safetyavg 0.16 | ||
| 🗳️ Ideological Leanavg 9.4 | ||
| 👥 Population Age Profileavg 4.84 | ||
| 🔥 Fire Safetyavg 0 | ||
| 🏫 School Quality |
River East Rankings
School Districts Serving River East
School Insights for River East
Below average outcomes; significant attendance and academic challenges.
School Insights
See what's really behind every school rating near River East
- Individual school ratings — each school's own score with outcome context, not just a district average
- Enrollment & class size data — student-to-teacher ratio and how it compares to the state average
- Full demographics breakdown — ethnicity and gender composition for every school in the enrollment zone
- Every school in the district — all schools within the enrollment boundary ranked by rating, not just the closest one
- Grade levels & benchmarks — elementary through high school, with below/above state-average flags
No credit card required