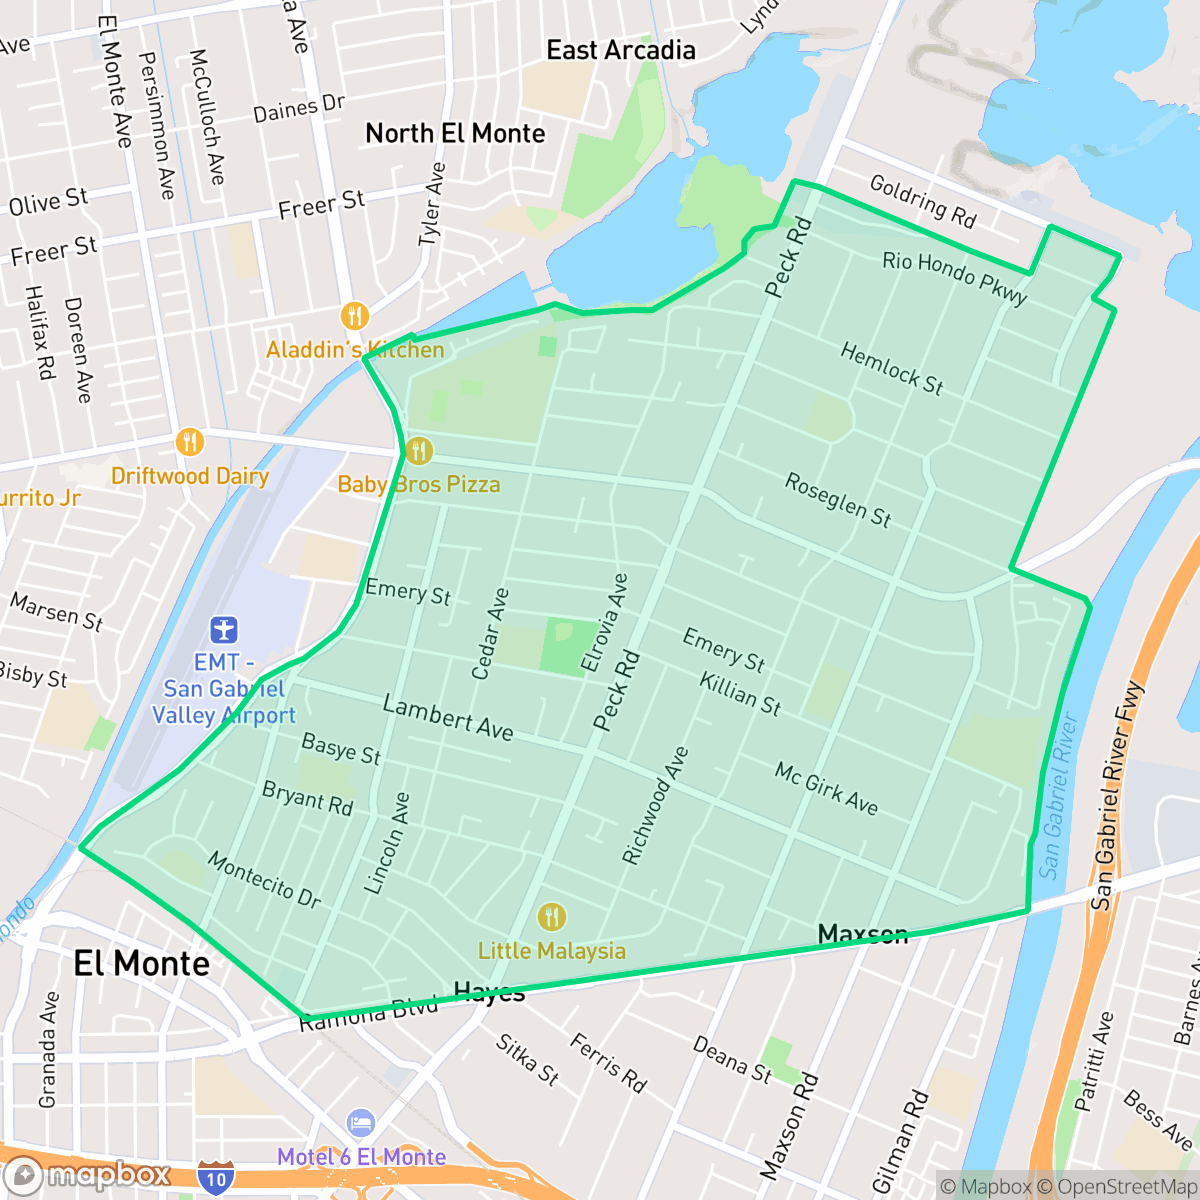
Norwood Cherrylee, El Monte
Updated June 22, 2026 · 30,621 residents
Norwood Cherrylee is a high-density suburban neighborhood in El Monte characterized by a consistent grid of walkable streets and compact residential housing. While the area offers convenient pedestrian access throughout its blocks, residents experience a notable level of road traffic noise and limited access to large public green spaces.
Key Highlights
About Norwood Cherrylee
Norwood Cherrylee functions as a dense residential enclave featuring a mix of single-family homes and multi-unit complexes. The neighborhood is defined by its standard tract housing, which typically features small lots and uniform architectural styles. Its location provides residents with a high degree of walkability due to a comprehensive grid of sidewalks, making daily pedestrian travel straightforward despite the surrounding suburban density.
Prospective residents should consider the trade-offs of living in a high-density environment, including close proximity to neighbors and limited private yard space. While the area benefits from proximity to local dining and services, it is also situated near industrial and warehouse zones, which contribute to elevated road traffic noise levels. The neighborhood is well-suited for those prioritizing pedestrian access and central location over expansive outdoor space or quiet, secluded surroundings.
Neighborhood Scores Across 15 Qualities
Residential structures and townhomes are closely positioned with minimal setbacks between neighbors. This density is roughly in line with the average seen throughout El Monte.
Continuous sidewalks and clear pedestrian crossings are available along most residential streets, matching the city average for walkability. While the established grid supports easy movement, heavy traffic on bordering arterial roads can occasionally impact pedestrian comfort.
Uniform tract housing with small yards and simple rooflines characterizes this area. The visual landscape is consistent with the city average, featuring dense residential layouts and few luxury amenities.
Walking dogs outside of private yards can be difficult because sidewalks feature narrow verges and there is a lack of large, accessible public parks. This level of accessibility is roughly average for the city of El Monte.
Residential streets and green spaces are balanced with commercial and industrial zones, mirroring the broader urban-rural mix found across El Monte. This environment features a dense grid of single-family homes interspersed with larger commercial blocks and industrial infrastructure.
A mix of lively dining pockets and quiet industrial zones defines this area, offering more activity and dining variety than the El Monte average. While several local eateries are accessible, much of the neighborhood remains car-dependent due to the presence of warehouses and freight corridors.
Frequent noise from nearby freeways and railroad tracks is a notable feature of this area. According to iHuus data, acoustic comfort levels are slightly below the El Monte city average.
Air quality remains mostly clean with rare instances of elevated readings, performing similarly to the El Monte average according to iHuus data.
Industrial presence is minimal, as the area consists primarily of residential and light commercial zones. According to iHuus data, this neighborhood has significantly fewer heavy industrial sites compared to the El Monte average.
Health insurance access is slightly higher in this area than the El Monte average, according to iHuus data. This indicates a moderate level of coverage among the resident population.
Voting patterns and census indicators show a predominantly liberal political leaning that is consistent with the broader El Monte area.
Residents live alongside a balanced mix of young adults, families, and seniors. This demographic distribution is largely consistent with the broader El Monte area according to iHuus data.
Flood risk in this area is significant and matches the city average. Residents should prepare for potentially elevated or prohibitive insurance costs due to the high hazard level.
Fire safety protections and infrastructure in this area are consistent with the city average. According to iHuus data, no significant deviations in fire risk levels were identified for this neighborhood.
Block-Level Insights for Norwood Cherrylee

iHuus Neighborhood Intelligence Insights
Get block-level neighborhood insights for Norwood Cherrylee
- Street-level scores — see how individual blocks compare, not just neighborhood averages
- Micro-zone boundaries — identify quiet pockets, flood boundaries, and walkable clusters before you visit
- 15 dimensions in full — walkability, noise, air quality, school quality, insurance coverage, population age profile, urban/rural index, and more
- Boundary risk alerts — know if your address sits near a block boundary where scores drop, the kind of detail no listing will ever mention
- School insights — individual school ratings and insights, not just district-level data
- Compare before you commit — side-by-side data across neighborhoods, down to block precision
No credit card required
Compare with Any Neighborhood
| Dimension | Norwood Cherrylee | Downtown |
|---|---|---|
| 🚶 Walkabilityavg 7.89 | ||
| 🔊 Acoustic Comfortavg 3.54 | ||
| 🤫 Privacy Indexavg 3.89 | ||
| 🎨 Visual Appealavg 5.51 | ||
| 🐕 Dog Friendlinessavg 4.38 | ||
| 🗺️ Urban-Rural Indexavg 6.21 | ||
| ✨ Neighborhood Vibeavg 4.71 | ||
| 🏥 Health Insurance Coverageavg 5.11 | ||
| 🌿 Air Qualityavg 8.12 | ||
| 🏭 Industrial Proximityavg 6.02 | ||
| 🌊 Flood Safetyavg 0.16 | ||
| 🗳️ Ideological Leanavg 9.4 | ||
| 👥 Population Age Profileavg 4.84 | ||
| 🔥 Fire Safetyavg 0 | ||
| 🏫 School Quality |
Norwood Cherrylee Rankings
School Districts Serving Norwood Cherrylee
El Monte City School District is a 'Mixed/Transition' organization characterized by a stark divide between its high-performing flagship elementary schools and several struggling campuses. While the district earns high marks for community trust—demonstrated by successful bond measures for security and facility upgrades—its overall academic standing remains average, with math scores trailing state benchmarks. Positive indicators include stable leadership, proactive investments in STEM and dual-language immersion, and a strong teacher-parent relationship. However, until the district can raise the performance floor of its lowest-rated schools (3/10) and address infrastructure inconsistencies like climate control, it remains a mid-tier district with strong upward momentum but significant internal variance.
Schools
El Monte Union High School District presents a tale of two organizations: one that delivers high-achieving academic results and prestigious extracurricular successes, and another that is currently mired in a significant legal and ethical crisis. While flagship schools like Arroyo and Rosemead consistently perform in the top tiers of California high schools with high graduation rates and elite college placements, the district is under a four-year court-supervised corrective plan following a DOJ investigation into systemic failures regarding student safety. This administrative instability, marked by survivor-led protests and public demands for leadership changes, offsets the district's strong educational metrics, resulting in a 'Mixed' status as the organization works to regain community trust and institutional integrity.
Schools
Mountain View Elementary School District is a district in transition, characterized by a mix of innovative specialized programming and significant pockets of academic underperformance. While the district has earned community trust through successful wellness initiatives, 'Green' English learner progress, and a strong Spanish Dual Language Immersion track, the portfolio is weighed down by a sharp divide in school quality, including two sites rated 1/10. Declining enrollment and plateaued mathematics scores present ongoing operational hurdles. Although teacher dedication and recent grant-funded improvements provide a foundation for growth, the district's overall stability is currently limited by inconsistent academic outcomes and the fiscal pressures of a shrinking student population.
Schools
School Insights for Norwood Cherrylee
Below average outcomes; significant attendance and academic challenges.
School Insights
See what's really behind every school rating near Norwood Cherrylee
- Individual school ratings — each school's own score with outcome context, not just a district average
- Enrollment & class size data — student-to-teacher ratio and how it compares to the state average
- Full demographics breakdown — ethnicity and gender composition for every school in the enrollment zone
- Every school in the district — all schools within the enrollment boundary ranked by rating, not just the closest one
- Grade levels & benchmarks — elementary through high school, with below/above state-average flags
No credit card required