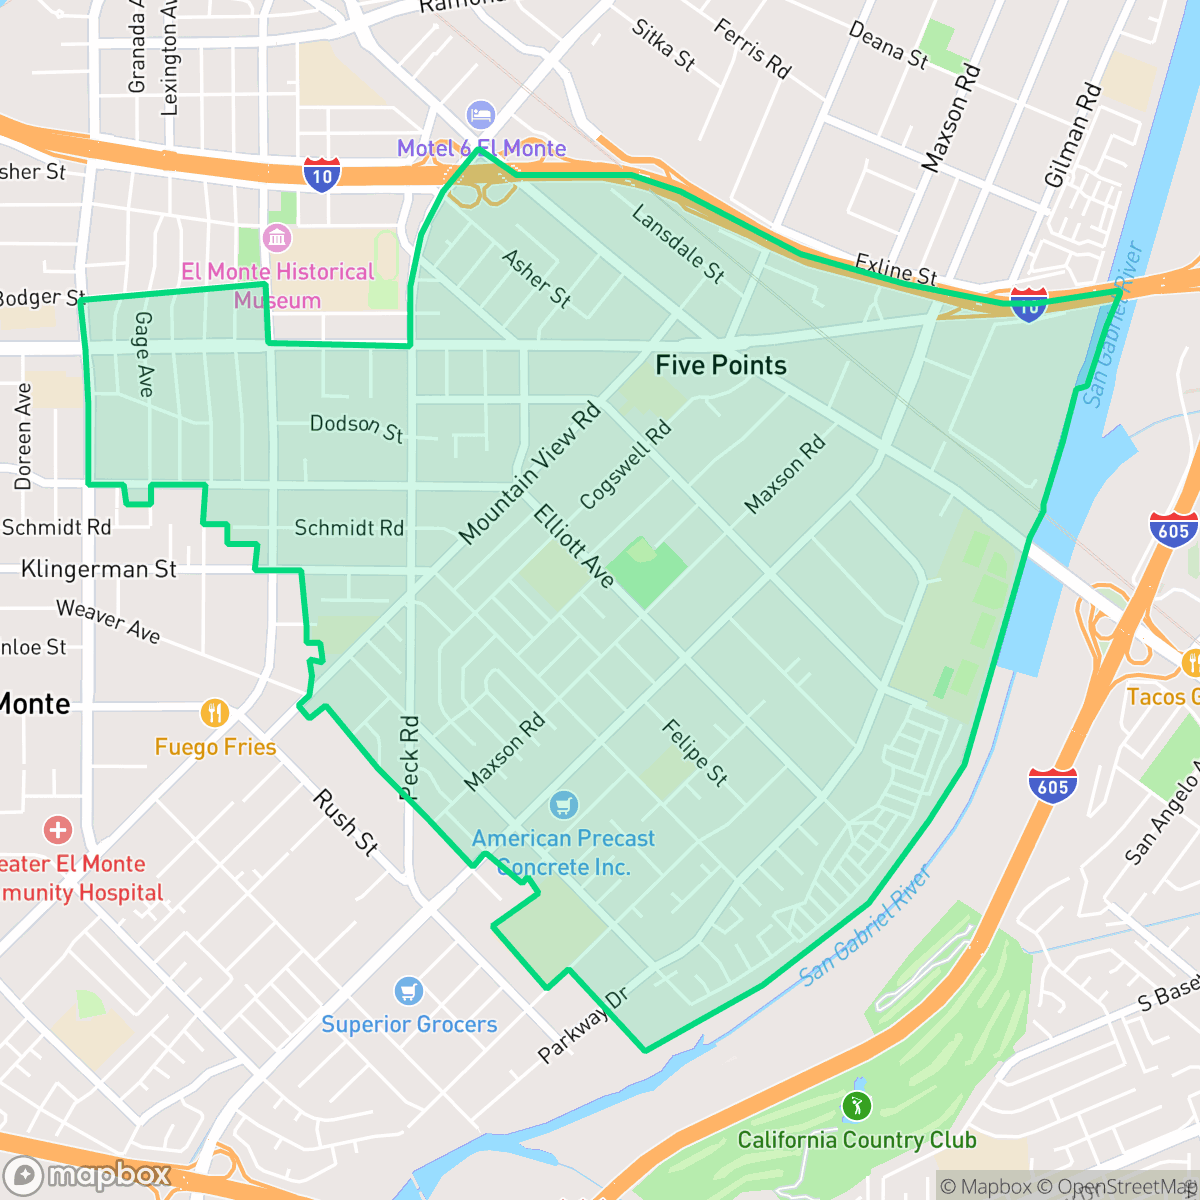
Mountain View, El Monte
Updated June 22, 2026 · 31,645 residents
Mountain View is a residential area in El Monte characterized by a balanced mix of tract housing and light industrial zones. While the neighborhood features a walkable street grid, residents frequently experience noise from nearby freeways and railroads.
Key Highlights
About Mountain View
Mountain View presents a dense, suburban landscape defined by standard tract housing and a steady, mixed-use rhythm. The area serves as a transit-adjacent hub where residential blocks sit near warehouse clusters and logistics facilities. This proximity to major transportation corridors creates a consistent, though often noisy, acoustic environment. Despite the industrial presence, the neighborhood maintains relatively clean air quality, offering a functional setting for a diverse demographic of young adults, families, and older residents.
Living in this neighborhood involves navigating specific trade-offs, particularly regarding property privacy and environmental safety. Homes are tightly packed with minimal setbacks, and the area faces a significant risk of flooding that requires careful consideration for prospective residents. While the street grid is largely walkable, the presence of heavy vehicle traffic and highway barriers makes the area primarily car-dependent for daily errands. Educational options in the surrounding districts are currently in a state of transition, offering both specialized programs and varying levels of academic performance across local campuses.
Neighborhood Scores Across 15 Qualities
Residential structures are closely packed with minimal setbacks and frequent shared walls or property lines. According to iHuus data, this density results in less privacy than the El Monte city average.
A consistent sidewalk network and gridded street pattern support pedestrian movement, though major highways and high-traffic industrial roads create notable barriers. This level of connectivity is slightly below the city average for El Monte.
Standard tract housing with boxy rooflines and small yards characterizes the area. The visual landscape matches the city average, featuring high-density residential lots and limited luxury amenities.
Public park access is limited and sidewalk verges are mostly narrow or paved, making this area slightly less dog friendly than the El Monte average. Most available greenery is found within private fenced yards rather than accessible public spaces.
Residential streets and green spaces are found in roughly equal measure to commercial and industrial zones. This landscape of single-family homes and apartment blocks is very similar to the broader El Monte area.
A balanced mix of residential life and light industrial services provides a steady rhythm that is slightly more active than the El Monte average. While local dining and social hubs are accessible, much of the area remains car-dependent due to the presence of warehouse corridors and highways.
Frequent noise from nearby freeways and railroad tracks characterizes this area. This level of acoustic disturbance is consistent with the average seen throughout El Monte.
Air quality remains mostly clean with only rare instances of elevated readings, performing slightly better than the El Monte average according to iHuus data.
Significant warehouse clusters and logistics hubs featuring truck loading bays are interspersed within residential blocks, creating an environment slightly more industrial than the El Monte average. Residents may experience increased heavy vehicle traffic and noise near the highway and southern utility corridors according to iHuus data.
Health insurance access is lower in Mountain View compared to the El Monte average, according to iHuus data.
Voting patterns and census indicators show a predominantly liberal political leaning, which is slightly more pronounced than the El Monte city average according to iHuus data.
Residents live among a balanced variety of young adults, families, and older individuals. This age distribution is nearly in line with the El Monte city average according to iHuus data.
Significant flood hazards exist in this area, which is slightly more pronounced than the El Monte average. Residents should prepare for potentially elevated or prohibitive flood insurance costs.
Block-Level Insights for Mountain View

iHuus Neighborhood Intelligence Insights
Get block-level neighborhood insights for Mountain View
- Street-level scores — see how individual blocks compare, not just neighborhood averages
- Micro-zone boundaries — identify quiet pockets, flood boundaries, and walkable clusters before you visit
- 15 dimensions in full — walkability, noise, air quality, school quality, insurance coverage, population age profile, urban/rural index, and more
- Boundary risk alerts — know if your address sits near a block boundary where scores drop, the kind of detail no listing will ever mention
- School insights — individual school ratings and insights, not just district-level data
- Compare before you commit — side-by-side data across neighborhoods, down to block precision
No credit card required
Compare with Any Neighborhood
| Dimension | Mountain View | Downtown |
|---|---|---|
| 🚶 Walkabilityavg 7.89 | ||
| 🔊 Acoustic Comfortavg 3.54 | ||
| 🤫 Privacy Indexavg 3.89 | ||
| 🎨 Visual Appealavg 5.51 | ||
| 🐕 Dog Friendlinessavg 4.38 | ||
| 🗺️ Urban-Rural Indexavg 6.21 | ||
| ✨ Neighborhood Vibeavg 4.71 | ||
| 🏥 Health Insurance Coverageavg 5.11 | ||
| 🌿 Air Qualityavg 8.12 | ||
| 🏭 Industrial Proximityavg 6.02 | ||
| 🌊 Flood Safetyavg 0.16 | ||
| 🗳️ Ideological Leanavg 9.4 | ||
| 👥 Population Age Profileavg 4.84 | ||
| 🔥 Fire Safetyavg 0 | ||
| 🏫 School Quality |
Mountain View Rankings
School Districts Serving Mountain View
El Monte City School District is a 'Mixed/Transition' organization characterized by a stark divide between its high-performing flagship elementary schools and several struggling campuses. While the district earns high marks for community trust—demonstrated by successful bond measures for security and facility upgrades—its overall academic standing remains average, with math scores trailing state benchmarks. Positive indicators include stable leadership, proactive investments in STEM and dual-language immersion, and a strong teacher-parent relationship. However, until the district can raise the performance floor of its lowest-rated schools (3/10) and address infrastructure inconsistencies like climate control, it remains a mid-tier district with strong upward momentum but significant internal variance.
Schools
El Monte Union High School District presents a tale of two organizations: one that delivers high-achieving academic results and prestigious extracurricular successes, and another that is currently mired in a significant legal and ethical crisis. While flagship schools like Arroyo and Rosemead consistently perform in the top tiers of California high schools with high graduation rates and elite college placements, the district is under a four-year court-supervised corrective plan following a DOJ investigation into systemic failures regarding student safety. This administrative instability, marked by survivor-led protests and public demands for leadership changes, offsets the district's strong educational metrics, resulting in a 'Mixed' status as the organization works to regain community trust and institutional integrity.
Schools
Mountain View Elementary School District is a district in transition, characterized by a mix of innovative specialized programming and significant pockets of academic underperformance. While the district has earned community trust through successful wellness initiatives, 'Green' English learner progress, and a strong Spanish Dual Language Immersion track, the portfolio is weighed down by a sharp divide in school quality, including two sites rated 1/10. Declining enrollment and plateaued mathematics scores present ongoing operational hurdles. Although teacher dedication and recent grant-funded improvements provide a foundation for growth, the district's overall stability is currently limited by inconsistent academic outcomes and the fiscal pressures of a shrinking student population.
Schools
School Insights for Mountain View
Below average outcomes; significant attendance and academic challenges.
School Insights
See what's really behind every school rating near Mountain View
- Individual school ratings — each school's own score with outcome context, not just a district average
- Enrollment & class size data — student-to-teacher ratio and how it compares to the state average
- Full demographics breakdown — ethnicity and gender composition for every school in the enrollment zone
- Every school in the district — all schools within the enrollment boundary ranked by rating, not just the closest one
- Grade levels & benchmarks — elementary through high school, with below/above state-average flags
No credit card required