Sterling Downs, Belmont
Updated June 22, 2026 · 2,278 residents
Sterling Downs is a highly walkable neighborhood in Belmont known for its flat terrain and convenient access to local amenities like Alexander Park and diverse dining options. While the area offers a vibrant suburban atmosphere, residents should be aware of the elevated noise levels from nearby road traffic and the industrial proximity of the railway corridor.
Key Highlights
About Sterling Downs
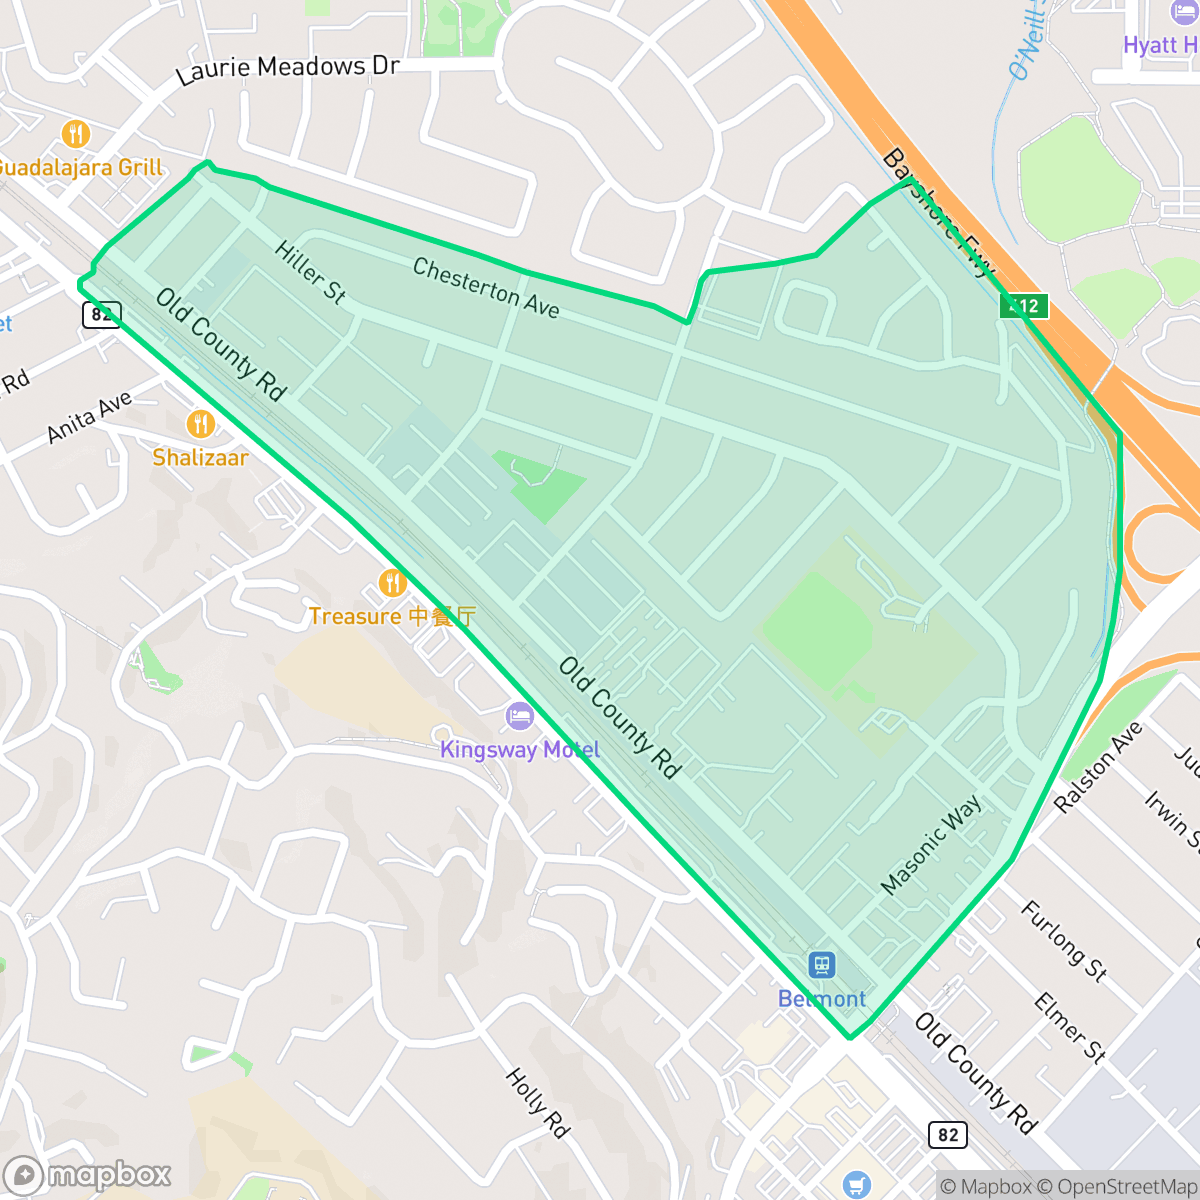
Located east of El Camino Real and north of Ralston Avenue, the flat Sterling Downs neighborhood of Belmont, California, has a rich mid-century and wartime history. During the 1930s, the area was occupied by the Belmont Airport (also known as Belmont Landing Field), which featured an unpaved runway. During World War II, the airfield was displaced by Camp Belmont, a U.S. Army camp where the 76th Field Artillery Battalion was stationed to guard the Pacific Coast. In 1951, the airport was abandoned and subdivided for residential development. The military camp and airfield were replaced by Nesbit Elementary School and a tract of neat, post-war, single-family ranch-style cottages. Today, the neighborhood is known for its flat, accessible layout, tight-knit community, and local spaces like Alexander Park.
The area features a mix of single-family homes and multi-story apartments, creating a dense suburban environment. Residents enjoy high walkability and proximity to community staples, including St Mark Catholic Church and various restaurants along the commercial strips. According to iHuus data, the neighborhood maintains a strong sense of community, supported by well-maintained public spaces that facilitate outdoor activity for pets and pedestrians alike.
Prospective residents should weigh the benefits of the accessible, flat layout against specific environmental factors. The area experiences significant road traffic noise, and the proximity to the railway corridor introduces industrial activity that may impact acoustic comfort. Additionally, the neighborhood faces challenges regarding flood and fire safety, which are important considerations for long-term planning. It is best suited for those who prioritize walkability and a central location within the Peninsula over absolute quiet or seclusion.
Neighborhood Scores Across 15 Qualities
Residential spacing varies from shared-wall apartments to secluded hillside estates with significant buffers. According to iHuus data, the level of separation between neighbors is roughly comparable to the Belmont average.
Continuous sidewalks and dedicated pedestrian paths are available on nearly all residential streets, making this area more pedestrian-friendly than the Belmont average. Safe crossings and a connected street grid allow for easy walking throughout the neighborhood, according to iHuus data.
Manicured lawns and private pools are common features of this area, though the overall visual quality sits slightly below the Belmont average. According to iHuus data, the landscape transitions from large custom hillside homes to more densely packed suburban housing and apartment complexes.
Abundant green buffers, trails, and nearby parklands provide ample space for pets. While the neighborhood offers accessible walking paths, it is slightly less dog friendly than the Belmont average.
Frequent open land and scattered homes amidst woodland provide a more semi-rural feel than the more densely developed parts of Belmont. According to iHuus data, this area maintains more greenery and open space than the city average.
Local amenities and diverse dining options provide a more vibrant atmosphere than the typical Belmont average. Residents can access a variety of eateries and parks within a landscape that balances quiet residential streets with nearby commercial pockets.
Frequent noise from nearby airport runways creates significant acoustic disruption. This level of sound exposure is substantially higher than the average for Belmont.
Air quality in Sterling Downs is consistent with the Belmont average, presenting a mix of acceptable and unhealthy days that may cause occasional concern for sensitive groups.
Industrial presence is minimal within the immediate neighborhood, though nearby railway corridors and large commercial warehouses may introduce some light industrial activity. This area remains largely residential and recreational, appearing slightly more exposed to commercial traffic than the broader Belmont area according to iHuus data.
Health insurance access is nearly universal among residents, remaining slightly above the Belmont average according to iHuus data.
Voting patterns and census indicators in Sterling Downs reflect a deeply liberal leaning that is consistent with the broader Belmont area, according to iHuus data.
Residents live alongside a balanced mix of young adults, families, and older individuals. This demographic variety is slightly lower than the average seen across Belmont.
Flood risk in this area is considered moderate, as FEMA has not yet completed a detailed study for this specific location. According to iHuus data, the level of risk is roughly comparable to the average for Belmont.
Block-Level Insights for Sterling Downs

iHuus Neighborhood Intelligence Insights
Get block-level neighborhood insights for Sterling Downs
- Street-level scores — see how individual blocks compare, not just neighborhood averages
- Micro-zone boundaries — identify quiet pockets, flood boundaries, and walkable clusters before you visit
- 15 dimensions in full — walkability, noise, air quality, school quality, insurance coverage, population age profile, urban/rural index, and more
- Boundary risk alerts — know if your address sits near a block boundary where scores drop, the kind of detail no listing will ever mention
- School insights — individual school ratings and insights, not just district-level data
- Compare before you commit — side-by-side data across neighborhoods, down to block precision
No credit card required
Compare with Any Neighborhood
| Dimension | Sterling Downs | Belmont Heights |
|---|---|---|
| 🚶 Walkabilityavg 7.7 | ||
| 🔊 Acoustic Comfortavg 4.56 | ||
| 🤫 Privacy Indexavg 5.95 | ||
| 🎨 Visual Appealavg 7.72 | ||
| 🐕 Dog Friendlinessavg 8.14 | ||
| 🗺️ Urban-Rural Indexavg 7.2 | ||
| ✨ Neighborhood Vibeavg 4.23 | ||
| 🏥 Health Insurance Coverageavg 9.26 | ||
| 🌿 Air Qualityavg 6 | ||
| 🏭 Industrial Proximityavg 9.46 | ||
| 🌊 Flood Safetyavg 5.37 | ||
| 🗳️ Ideological Leanavg 9.71 | ||
| 👥 Population Age Profileavg 4.96 | ||
| 🔥 Fire Safetyavg 0.71 | ||
| 🏫 School Quality |
Sterling Downs Rankings
School Districts Serving Sterling Downs
Belmont-Redwood Shores Elementary School District is a premier 'Blue Chip' organization characterized by exceptional academic performance, robust financial stability, and high community trust. With a portfolio dominated by top-tier ratings and a middle school that acts as a rigorous academic anchor, the district consistently outperforms state benchmarks. While a 'pressure cooker' environment and localized traffic issues are noted in anecdotal reports, the district's successful management of bond measures for infrastructure and its ability to maintain strong financial reserves despite state funding fluctuations confirm its status as a stable, high-performing corporate entity.
Schools
San Mateo Union High School District is a 'Blue Chip' educational entity characterized by elite academic performance, robust financial management, and high community confidence. With flagship schools like Aragon and Mills maintaining perfect ratings and a successful $96M bond measure funding modernizations, the district demonstrates organizational excellence. Despite regional trends of declining enrollment, SMUHSD manages localized growth effectively and maintains labor peace through competitive multi-year contracts. The district's ability to balance rigorous college-prep standards with progressive social initiatives and strong fiscal health solidifies its status as a top-tier California system.
Schools
San Mateo-Foster City Elementary School District is a solid and stable organization characterized by strong overall academic achievement and high teacher quality, ranking in the top 20% of California districts. While it faces significant operational challenges—including a $1.1 billion facilities modernization need and a $10 million budget deficit—proactive fiscal management and successful grant acquisition demonstrate institutional resilience. A stark achievement gap exists between its elite Foster City schools and several underperforming sites in San Mateo, but the district's expansion of specialized Montessori and STEM programs, coupled with high community trust as evidenced by planned bond measures, maintains its standing as a high-quality public school system.
Schools
Sequoia Union High School District remains an academic powerhouse with high-performing flagship schools like Carlmont and Menlo-Atherton consistently outpacing state standards; however, it is currently in a state of operational transition and controversy. The district faces significant community backlash following the decision to close the newly built TIDE Academy to address a $6 million deficit, alongside parent concerns regarding the removal of honors-level 'bridge' courses for younger students. While the core academic portfolio is robust, recent lawsuits involving staff misconduct and ongoing debates over curriculum equity and fiscal management signal internal instability that offsets its high-ranking test scores.
Schools
School Insights for Sterling Downs
Below average outcomes; significant attendance and academic challenges.
School Insights
See what's really behind every school rating near Sterling Downs
- Individual school ratings — each school's own score with outcome context, not just a district average
- Enrollment & class size data — student-to-teacher ratio and how it compares to the state average
- Full demographics breakdown — ethnicity and gender composition for every school in the enrollment zone
- Every school in the district — all schools within the enrollment boundary ranked by rating, not just the closest one
- Grade levels & benchmarks — elementary through high school, with below/above state-average flags
No credit card required