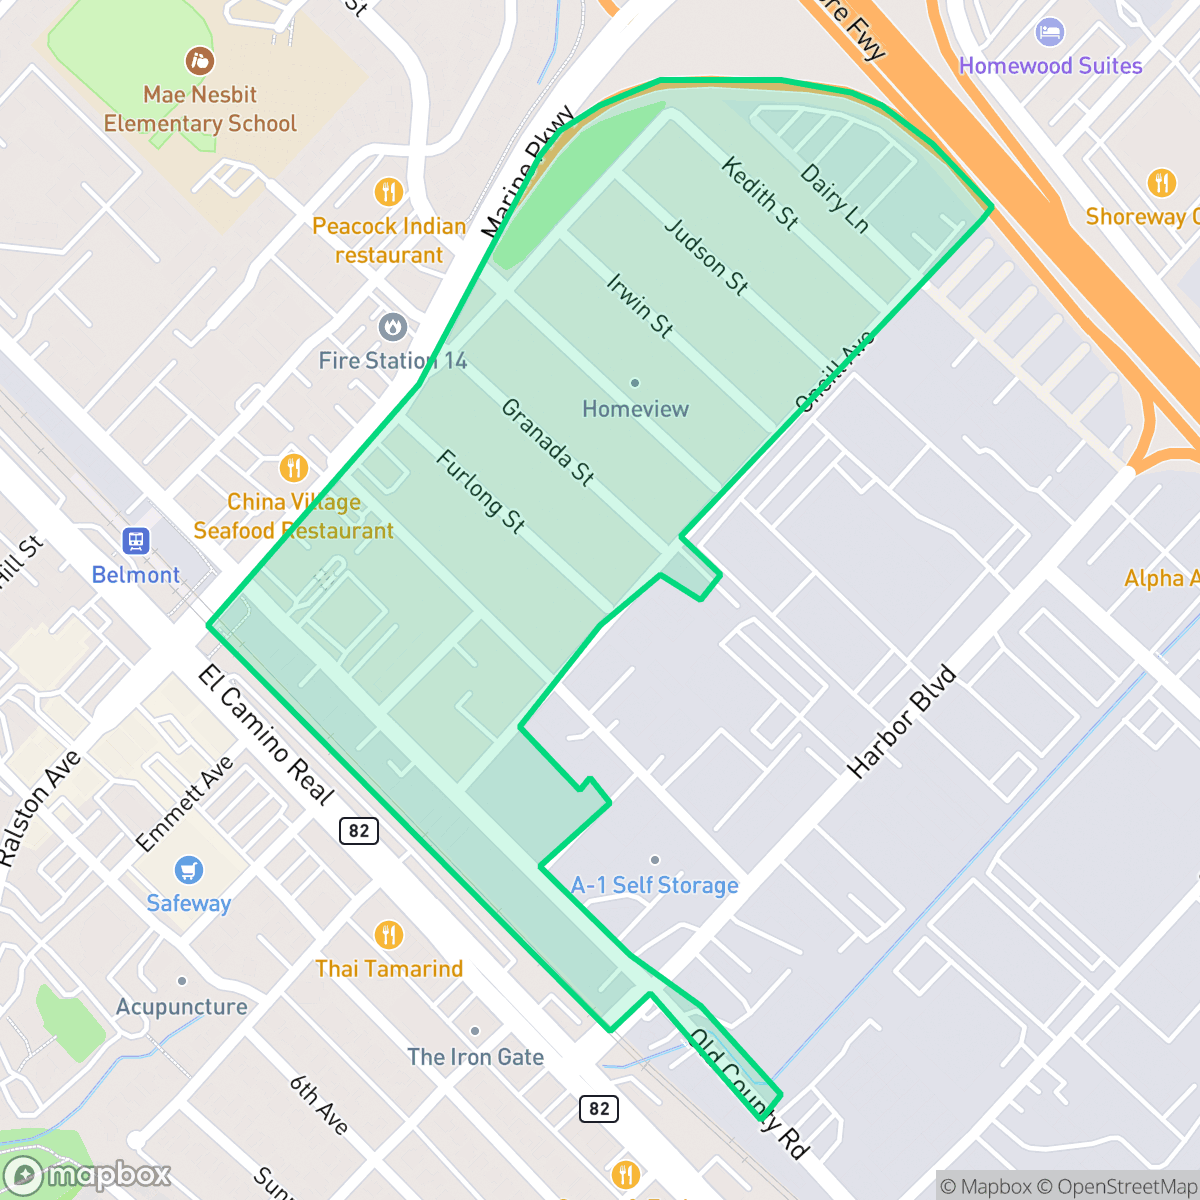
Homebire, Belmont
Updated June 22, 2026 · 462 residents
Homebire is a compact, highly walkable neighborhood in Belmont known for its blend of suburban streets and active commercial corridors. While the area offers convenient access to local dining and coffee shops, residents should be prepared for significant noise levels due to nearby road traffic.
Key Highlights
About Homebire
This neighborhood serves as a unique transition zone within Belmont, characterized by a mix of residential spaces and light industrial units. The area maintains high levels of visual appeal and walkability, allowing residents to easily access nearby amenities like Dog Haus Biergarten and Peet's Coffee. Despite its central location, the environment is notably active, with a liveliness score that reflects the constant movement of a mixed-use district. Prospective residents will find a community that prioritizes health and civic engagement, supported by access to the top-rated Belmont-Redwood Shores Elementary School District. However, the area presents distinct trade-offs, particularly regarding acoustic comfort, as road traffic contributes to a consistently loud environment. Additionally, those considering the location should be aware of the limited fire safety infrastructure and the ongoing operational transitions within the local high school district. It is best suited for individuals who value proximity to transit and retail over absolute quiet or rural seclusion.
Neighborhood Scores Across 15 Qualities
Residential spacing is moderate with some buffer between neighbors, though privacy levels are slightly lower than the Belmont average according to iHuus data.
Sidewalks are available on one side of the streets with safe crossings provided. This level of walkability is slightly below the Belmont average, according to iHuus data.
Large homes and spacious driveways characterize this area, though the overall visual appeal sits below the Belmont average according to iHuus data.
Limited access to public parks and wide green verges makes this area less ideal for dog owners compared to the rest of Belmont. According to iHuus data, pet-friendly infrastructure is notably lower than the city average.
Open land and scattered homes amidst woodland define this area, which feels less densely developed than the Belmont average. According to iHuus data, the landscape features a mix of low-density industrial zones and larger commercial structures alongside more natural terrain.
Local activity levels are higher than the Belmont average, characterized by a blend of suburban streets, light industrial units, and various dining options. According to iHuus data, the area maintains a balanced presence of residential life and functional services near major transit corridors.
Frequent aircraft noise from nearby runway proximity significantly impacts acoustic comfort, making this area much noisier than the Belmont average according to iHuus data.
Air quality in Homebire fluctuates between acceptable and unhealthy levels, consistent with the city average. According to iHuus data, sensitive groups may experience occasional concerns on certain days.
Light industrial warehouses and logistics centers are present alongside residential areas, resulting in significantly more commercial activity than the Belmont average. Residents may encounter increased daytime traffic from semi-trucks and delivery vehicles near these commercial hubs.
Nearly all residents possess health insurance, representing a rate that is higher than the Belmont city average according to iHuus data.
Voting patterns and census indicators reflect a very liberal political leaning, which is consistent with the broader Belmont area according to iHuus data.
Residents experience a diverse age distribution ranging from young adults to seniors; this demographic spread is slightly more varied than the average across Belmont.
Flood risk in this area is difficult to determine because FEMA has not completed a detailed study for the neighborhood. According to iHuus data, the potential for flooding is higher than the average for Belmont.
Block-Level Insights for Homebire

iHuus Neighborhood Intelligence Insights
Get block-level neighborhood insights for Homebire
- Street-level scores — see how individual blocks compare, not just neighborhood averages
- Micro-zone boundaries — identify quiet pockets, flood boundaries, and walkable clusters before you visit
- 15 dimensions in full — walkability, noise, air quality, school quality, insurance coverage, population age profile, urban/rural index, and more
- Boundary risk alerts — know if your address sits near a block boundary where scores drop, the kind of detail no listing will ever mention
- School insights — individual school ratings and insights, not just district-level data
- Compare before you commit — side-by-side data across neighborhoods, down to block precision
No credit card required
Compare with Any Neighborhood
| Dimension | Homebire | Belmont Heights |
|---|---|---|
| 🚶 Walkabilityavg 7.7 | ||
| 🔊 Acoustic Comfortavg 4.56 | ||
| 🤫 Privacy Indexavg 5.95 | ||
| 🎨 Visual Appealavg 7.72 | ||
| 🐕 Dog Friendlinessavg 8.14 | ||
| 🗺️ Urban-Rural Indexavg 7.2 | ||
| ✨ Neighborhood Vibeavg 4.23 | ||
| 🏥 Health Insurance Coverageavg 9.26 | ||
| 🌿 Air Qualityavg 6 | ||
| 🏭 Industrial Proximityavg 9.46 | ||
| 🌊 Flood Safetyavg 5.37 | ||
| 🗳️ Ideological Leanavg 9.71 | ||
| 👥 Population Age Profileavg 4.96 | ||
| 🔥 Fire Safetyavg 0.71 | ||
| 🏫 School Quality |
Homebire Rankings
School Districts Serving Homebire
Belmont-Redwood Shores Elementary School District is a premier 'Blue Chip' organization characterized by exceptional academic performance, robust financial stability, and high community trust. With a portfolio dominated by top-tier ratings and a middle school that acts as a rigorous academic anchor, the district consistently outperforms state benchmarks. While a 'pressure cooker' environment and localized traffic issues are noted in anecdotal reports, the district's successful management of bond measures for infrastructure and its ability to maintain strong financial reserves despite state funding fluctuations confirm its status as a stable, high-performing corporate entity.
Schools
Sequoia Union High School District remains an academic powerhouse with high-performing flagship schools like Carlmont and Menlo-Atherton consistently outpacing state standards; however, it is currently in a state of operational transition and controversy. The district faces significant community backlash following the decision to close the newly built TIDE Academy to address a $6 million deficit, alongside parent concerns regarding the removal of honors-level 'bridge' courses for younger students. While the core academic portfolio is robust, recent lawsuits involving staff misconduct and ongoing debates over curriculum equity and fiscal management signal internal instability that offsets its high-ranking test scores.
Schools
School Insights for Homebire
Below average outcomes; significant attendance and academic challenges.
School Insights
See what's really behind every school rating near Homebire
- Individual school ratings — each school's own score with outcome context, not just a district average
- Enrollment & class size data — student-to-teacher ratio and how it compares to the state average
- Full demographics breakdown — ethnicity and gender composition for every school in the enrollment zone
- Every school in the district — all schools within the enrollment boundary ranked by rating, not just the closest one
- Grade levels & benchmarks — elementary through high school, with below/above state-average flags
No credit card required