Downtown, Belmont
Updated June 22, 2026 · 1,250 residents
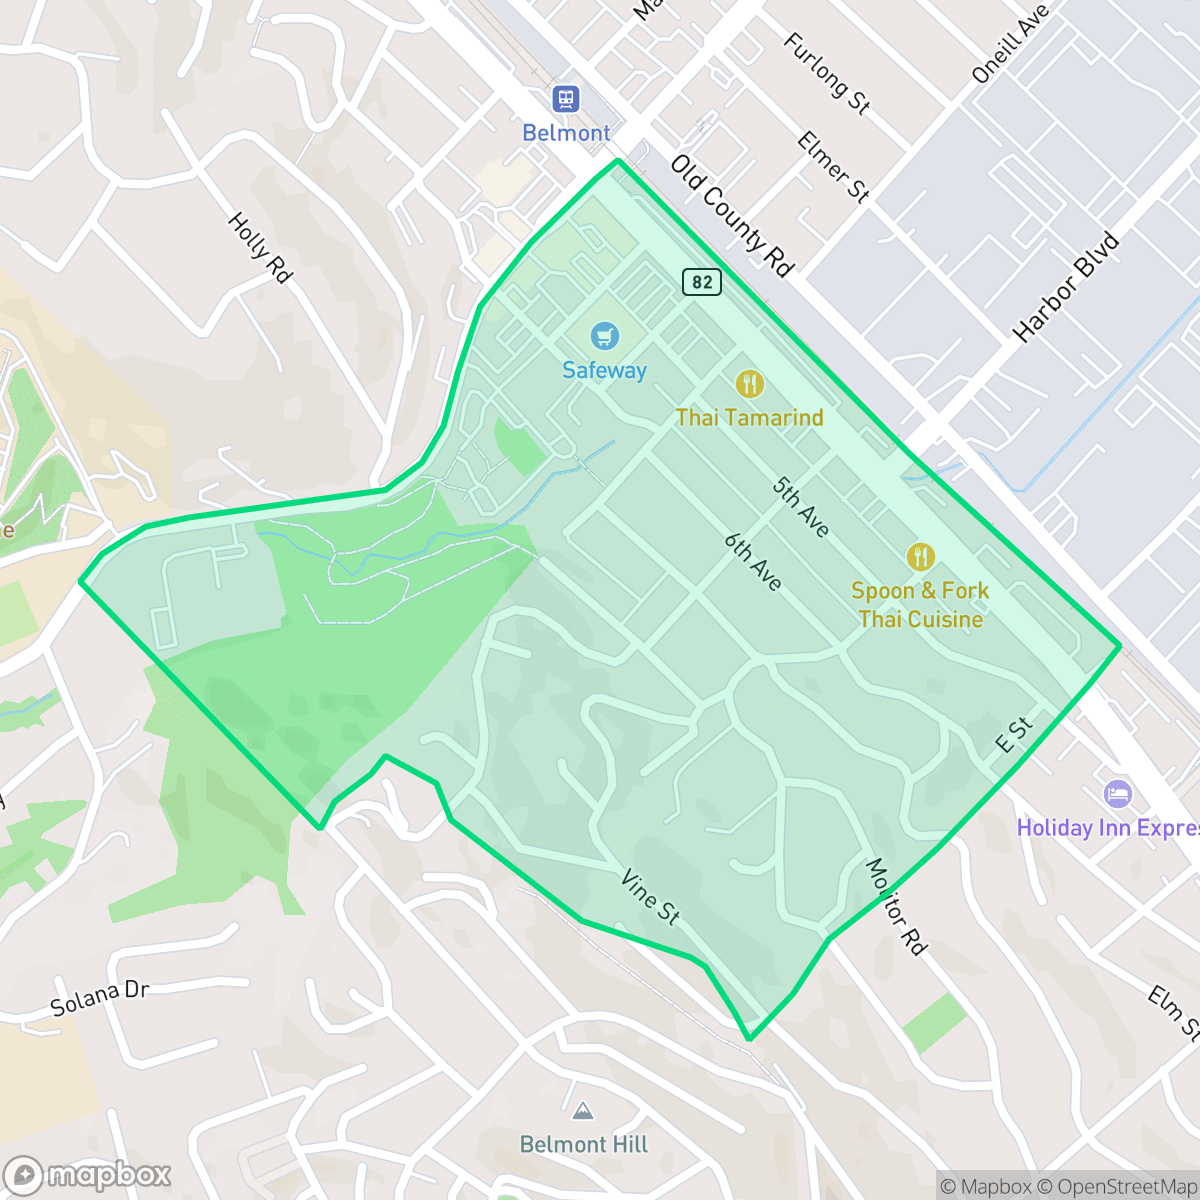
Centered around the intersection of Ralston Avenue and El Camino Real, this neighborhood serves as a modest commercial hub within an otherwise quiet, hillside city. It offers a semi-rural atmosphere with a steady suburban rhythm and reliable access to local services.
Key Highlights
About Downtown
Belmont's downtown is historically unique because the city developed without a traditional central commercial hub, largely due to its hilly topography and origins as a collection of wealthy San Francisco families' summer estates. While the area was plotted as early as 1864, the lack of a central train station—unlike neighboring Peninsula cities—inhibited the growth of a conventional downtown. For decades, residents relied on nearby communities for commerce. Efforts to formalize a downtown center began in the late 1980s with the ratification of a Downtown Specific Plan, but development remained limited by restrictive zoning and community preference for a quiet, residential character. Today, the area near Ralston Avenue and El Camino Real serves as a modest commercial core, contrasting with the city’s historic identity as a serene, hillside retreat.
The area functions as a central point for dining and essential services, maintaining a distinct character that balances suburban tranquility with accessible amenities. Residents benefit from a semi-rural landscape defined by scattered greenery and open spaces, which helps preserve a sense of privacy despite the proximity to commercial zones. The neighborhood is generally walkable, providing safe pedestrian access to local shops and services, while the overall aesthetic remains well-maintained and upscale.
Living here involves certain trade-offs, particularly regarding acoustic comfort, as traffic from major thoroughfares creates a continuous ambient hum. While the area enjoys high levels of health insurance coverage and a diverse age demographic, prospective residents should consider the local school district landscape. The elementary education options are highly regarded for their academic performance and financial stability, though the high school district is currently navigating internal administrative transitions and fiscal challenges.
Neighborhood Scores Across 15 Qualities
Residential spacing offers a balanced mix of proximity and distance between neighbors. This level of density is consistent with the city average, according to iHuus data.
Pedestrian access is supported by safe crossings and sidewalks on one side of the street. This level of walkability is slightly below the average for Belmont.
Upscale amenities and spacious properties characterize this area. The visual quality is slightly below the Belmont city average.
Accessible green spaces and wide paths provide safe environments for pets. While many areas are suitable for dog owners, the level of connectivity is slightly lower than the Belmont average.
Frequent open land and scattered greenery define this area, aligning with the broader city average. According to iHuus data, the landscape features a mix of woodland and light industrial structures within a suburban context.
A mix of dining options and local services provides a level of activity that is slightly higher than the Belmont average. While some areas near the railway offer walkable social hubs, other pockets remain quiet and car-dependent.
Local traffic from nearby busy streets creates a noticeable, continuous sound. This level of acoustic activity is higher than the average found throughout the rest of Belmont.
Air quality fluctuates between acceptable and unhealthy levels, presenting occasional concerns for sensitive groups. This stability is consistent with the average levels found throughout Belmont.
Industrial activity is quite low here, featuring only occasional light commercial zones. This area is notably more residential and less industrial than the Belmont average, according to iHuus data.
Health insurance access is widespread among residents, though slightly lower than the average for the rest of Belmont. According to iHuus data, the vast majority of the population is covered.
Voting patterns and census indicators reflect a predominantly liberal community, which is consistent with the broader Belmont area according to iHuus data.
A balanced mix of young adults, families, and older residents characterizes this area. This demographic distribution is slightly more varied than the average found throughout Belmont.
Flood risk in this area is considered moderate, as FEMA has not yet completed a detailed study for this specific location. According to iHuus data, the level of risk is roughly comparable to the average for Belmont.
Block-Level Insights for Downtown

iHuus Neighborhood Intelligence Insights
Get block-level neighborhood insights for Downtown
- Street-level scores — see how individual blocks compare, not just neighborhood averages
- Micro-zone boundaries — identify quiet pockets, flood boundaries, and walkable clusters before you visit
- 15 dimensions in full — walkability, noise, air quality, school quality, insurance coverage, population age profile, urban/rural index, and more
- Boundary risk alerts — know if your address sits near a block boundary where scores drop, the kind of detail no listing will ever mention
- School insights — individual school ratings and insights, not just district-level data
- Compare before you commit — side-by-side data across neighborhoods, down to block precision
No credit card required
Compare with Any Neighborhood
| Dimension | Downtown | Belmont Heights |
|---|---|---|
| 🚶 Walkabilityavg 7.7 | ||
| 🔊 Acoustic Comfortavg 4.56 | ||
| 🤫 Privacy Indexavg 5.95 | ||
| 🎨 Visual Appealavg 7.72 | ||
| 🐕 Dog Friendlinessavg 8.14 | ||
| 🗺️ Urban-Rural Indexavg 7.2 | ||
| ✨ Neighborhood Vibeavg 4.23 | ||
| 🏥 Health Insurance Coverageavg 9.26 | ||
| 🌿 Air Qualityavg 6 | ||
| 🏭 Industrial Proximityavg 9.46 | ||
| 🌊 Flood Safetyavg 5.37 | ||
| 🗳️ Ideological Leanavg 9.71 | ||
| 👥 Population Age Profileavg 4.96 | ||
| 🔥 Fire Safetyavg 0.71 | ||
| 🏫 School Quality |
Downtown Rankings
School Districts Serving Downtown
Belmont-Redwood Shores Elementary School District is a premier 'Blue Chip' organization characterized by exceptional academic performance, robust financial stability, and high community trust. With a portfolio dominated by top-tier ratings and a middle school that acts as a rigorous academic anchor, the district consistently outperforms state benchmarks. While a 'pressure cooker' environment and localized traffic issues are noted in anecdotal reports, the district's successful management of bond measures for infrastructure and its ability to maintain strong financial reserves despite state funding fluctuations confirm its status as a stable, high-performing corporate entity.
Schools
Sequoia Union High School District remains an academic powerhouse with high-performing flagship schools like Carlmont and Menlo-Atherton consistently outpacing state standards; however, it is currently in a state of operational transition and controversy. The district faces significant community backlash following the decision to close the newly built TIDE Academy to address a $6 million deficit, alongside parent concerns regarding the removal of honors-level 'bridge' courses for younger students. While the core academic portfolio is robust, recent lawsuits involving staff misconduct and ongoing debates over curriculum equity and fiscal management signal internal instability that offsets its high-ranking test scores.
Schools
School Insights for Downtown
Below average outcomes; significant attendance and academic challenges.
School Insights
See what's really behind every school rating near Downtown
- Individual school ratings — each school's own score with outcome context, not just a district average
- Enrollment & class size data — student-to-teacher ratio and how it compares to the state average
- Full demographics breakdown — ethnicity and gender composition for every school in the enrollment zone
- Every school in the district — all schools within the enrollment boundary ranked by rating, not just the closest one
- Grade levels & benchmarks — elementary through high school, with below/above state-average flags
No credit card required