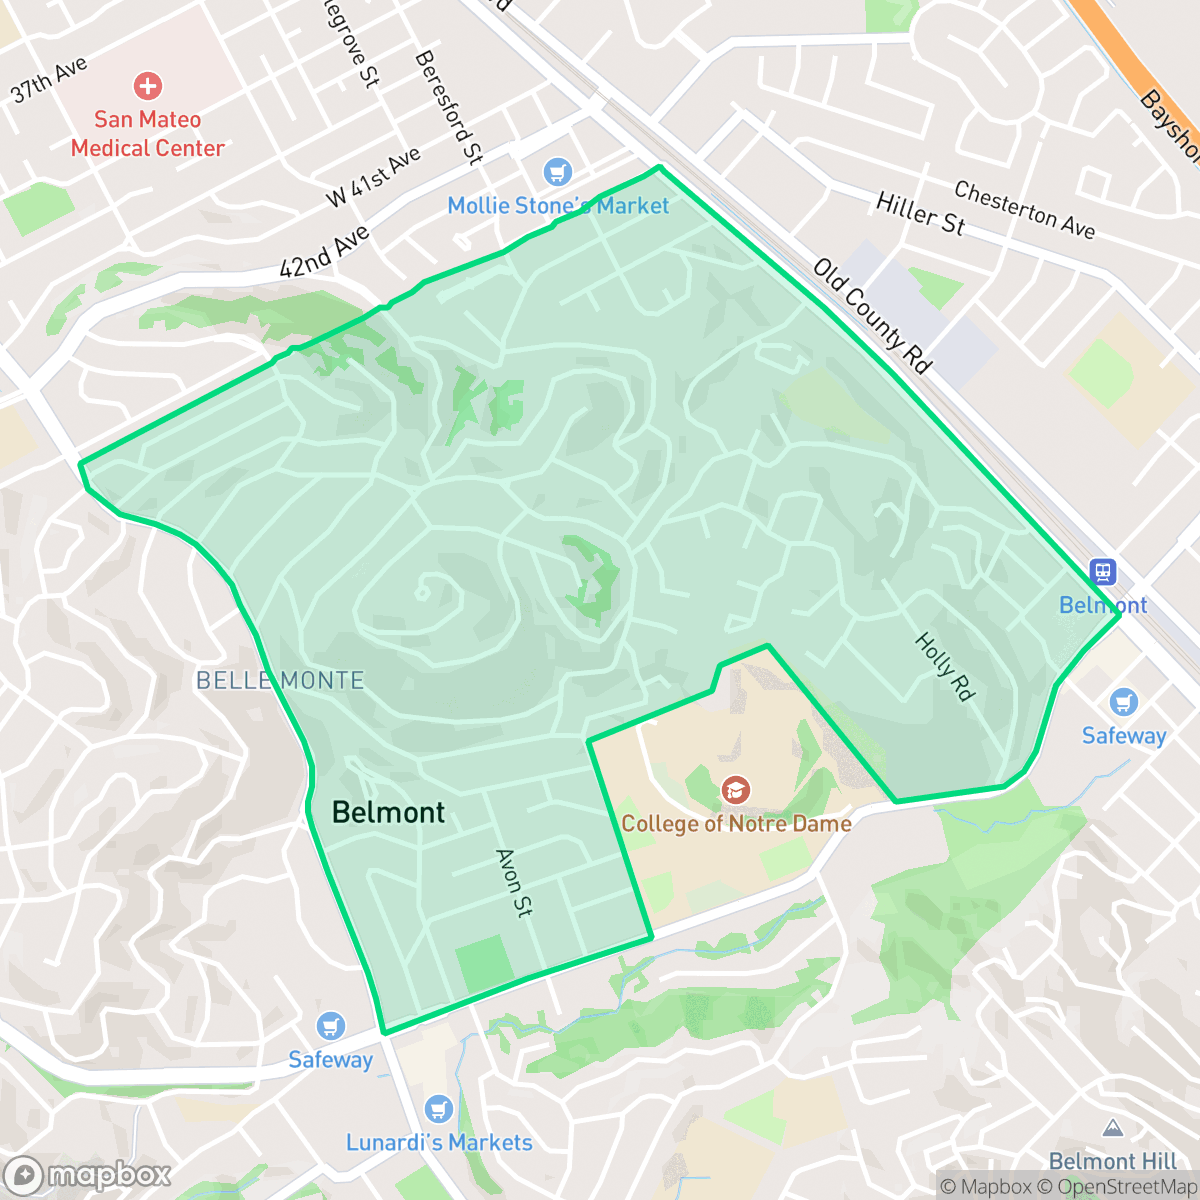
Central, Belmont
Updated June 22, 2026 · 6,216 residents
Central is an upscale residential neighborhood characterized by well-maintained landscapes and a mature tree canopy. The area offers a highly walkable environment with easy access to local services, though residents should expect moderate traffic noise from nearby thoroughfares.
Key Highlights
About Central
Central is a purely residential neighborhood that features a blend of single-family homes and multi-unit complexes. The area is defined by its affluent atmosphere, varied rooflines, and manicured grounds that benefit from significant tree cover. With no industrial activity or large-scale commercial hazards, the neighborhood maintains a steady suburban rhythm that is both quiet and accessible. According to iHuus data, the area provides a balanced mix of amenities, making it a convenient location for those who value both privacy and proximity to local dining and parks.
Living in this neighborhood involves a trade-off between its high walkability and the presence of moderate traffic noise from surrounding streets. The demographic profile is diverse, appealing to young adults, families, and older residents alike. Prospective residents will find excellent educational opportunities through the highly-rated local school districts, which are known for their academic performance and financial stability. The area is well-suited for individuals seeking a stable, well-connected community with high levels of health insurance coverage and a strong sense of local identity.
Neighborhood Scores Across 15 Qualities
Residential spacing is consistent with the Belmont city average, featuring a blend of detached homes with modest yards and denser apartment clusters. Many properties benefit from significant tree canopy that provides additional separation between neighbors.
Continuous sidewalks and low-traffic residential streets provide safe pedestrian routes throughout the area. According to iHuus data, the connectivity and ease of navigation in this neighborhood are better than the Belmont average.
Manicured grounds, private pools, and large custom homes on hillsides create an affluent atmosphere that is consistent with the Belmont city average. According to iHuus data, the area features varied rooflines and well-maintained landscapes throughout the neighborhood.
Wooded residential streets and central greenbelts provide many areas for exercise. While several parks offer ample space, the neighborhood is slightly less dog friendly than the Belmont average due to narrower sidewalks and more private yard space.
Residential areas feature a mix of single-family homes and multi-unit complexes nestled within a mature tree canopy. This landscape is slightly more developed and less open than the typical semi-rural surroundings found elsewhere in Belmont.
A moderate mix of dining, parks, and local services creates a balanced atmosphere that is more lively than the Belmont average. Residents can access various cafes and eateries within walkable distances, though some areas remain primarily quiet and residential.
Steady noise from nearby thoroughfares is a common feature here, making the acoustic environment slightly less tranquil than other parts of Belmont.
Air quality in this area fluctuates between acceptable and unhealthy levels, presenting occasional concerns for sensitive groups. This level of air quality is consistent with the average found across Belmont.
Industrial activity and warehouses are absent from this area, making it comparable to the rest of Belmont in terms of low industrial proximity. Residents will find an environment free from heavy manufacturing, chimneys, or large-scale commercial hazards.
Nearly all residents in this area are covered by health insurance, a rate that is consistent with the broader Belmont area according to iHuus data.
Voting patterns and census indicators show a strong liberal leaning that is consistent with the city average.
Residents live alongside a balanced mix of young adults, families, and older populations. This demographic spread is closely aligned with the average seen across Belmont.
Flood risk in this area remains uncertain because FEMA has not yet completed a detailed study for this specific location. According to iHuus data, the risk level is consistent with the average for the city of Belmont.
Block-Level Insights for Central

iHuus Neighborhood Intelligence Insights
Get block-level neighborhood insights for Central
- Street-level scores — see how individual blocks compare, not just neighborhood averages
- Micro-zone boundaries — identify quiet pockets, flood boundaries, and walkable clusters before you visit
- 15 dimensions in full — walkability, noise, air quality, school quality, insurance coverage, population age profile, urban/rural index, and more
- Boundary risk alerts — know if your address sits near a block boundary where scores drop, the kind of detail no listing will ever mention
- School insights — individual school ratings and insights, not just district-level data
- Compare before you commit — side-by-side data across neighborhoods, down to block precision
No credit card required
Compare with Any Neighborhood
| Dimension | Central | Belmont Heights |
|---|---|---|
| 🚶 Walkabilityavg 7.7 | ||
| 🔊 Acoustic Comfortavg 4.56 | ||
| 🤫 Privacy Indexavg 5.95 | ||
| 🎨 Visual Appealavg 7.72 | ||
| 🐕 Dog Friendlinessavg 8.14 | ||
| 🗺️ Urban-Rural Indexavg 7.2 | ||
| ✨ Neighborhood Vibeavg 4.23 | ||
| 🏥 Health Insurance Coverageavg 9.26 | ||
| 🌿 Air Qualityavg 6 | ||
| 🏭 Industrial Proximityavg 9.46 | ||
| 🌊 Flood Safetyavg 5.37 | ||
| 🗳️ Ideological Leanavg 9.71 | ||
| 👥 Population Age Profileavg 4.96 | ||
| 🔥 Fire Safetyavg 0.71 | ||
| 🏫 School Quality |
Central Rankings
School Districts Serving Central
Belmont-Redwood Shores Elementary School District is a premier 'Blue Chip' organization characterized by exceptional academic performance, robust financial stability, and high community trust. With a portfolio dominated by top-tier ratings and a middle school that acts as a rigorous academic anchor, the district consistently outperforms state benchmarks. While a 'pressure cooker' environment and localized traffic issues are noted in anecdotal reports, the district's successful management of bond measures for infrastructure and its ability to maintain strong financial reserves despite state funding fluctuations confirm its status as a stable, high-performing corporate entity.
Schools
San Mateo Union High School District is a 'Blue Chip' educational entity characterized by elite academic performance, robust financial management, and high community confidence. With flagship schools like Aragon and Mills maintaining perfect ratings and a successful $96M bond measure funding modernizations, the district demonstrates organizational excellence. Despite regional trends of declining enrollment, SMUHSD manages localized growth effectively and maintains labor peace through competitive multi-year contracts. The district's ability to balance rigorous college-prep standards with progressive social initiatives and strong fiscal health solidifies its status as a top-tier California system.
Schools
San Mateo-Foster City Elementary School District is a solid and stable organization characterized by strong overall academic achievement and high teacher quality, ranking in the top 20% of California districts. While it faces significant operational challenges—including a $1.1 billion facilities modernization need and a $10 million budget deficit—proactive fiscal management and successful grant acquisition demonstrate institutional resilience. A stark achievement gap exists between its elite Foster City schools and several underperforming sites in San Mateo, but the district's expansion of specialized Montessori and STEM programs, coupled with high community trust as evidenced by planned bond measures, maintains its standing as a high-quality public school system.
Schools
Sequoia Union High School District remains an academic powerhouse with high-performing flagship schools like Carlmont and Menlo-Atherton consistently outpacing state standards; however, it is currently in a state of operational transition and controversy. The district faces significant community backlash following the decision to close the newly built TIDE Academy to address a $6 million deficit, alongside parent concerns regarding the removal of honors-level 'bridge' courses for younger students. While the core academic portfolio is robust, recent lawsuits involving staff misconduct and ongoing debates over curriculum equity and fiscal management signal internal instability that offsets its high-ranking test scores.
Schools
School Insights for Central
Below average outcomes; significant attendance and academic challenges.
School Insights
See what's really behind every school rating near Central
- Individual school ratings — each school's own score with outcome context, not just a district average
- Enrollment & class size data — student-to-teacher ratio and how it compares to the state average
- Full demographics breakdown — ethnicity and gender composition for every school in the enrollment zone
- Every school in the district — all schools within the enrollment boundary ranked by rating, not just the closest one
- Grade levels & benchmarks — elementary through high school, with below/above state-average flags
No credit card required