Belmont Heights, Belmont
Updated · 1,109 residents
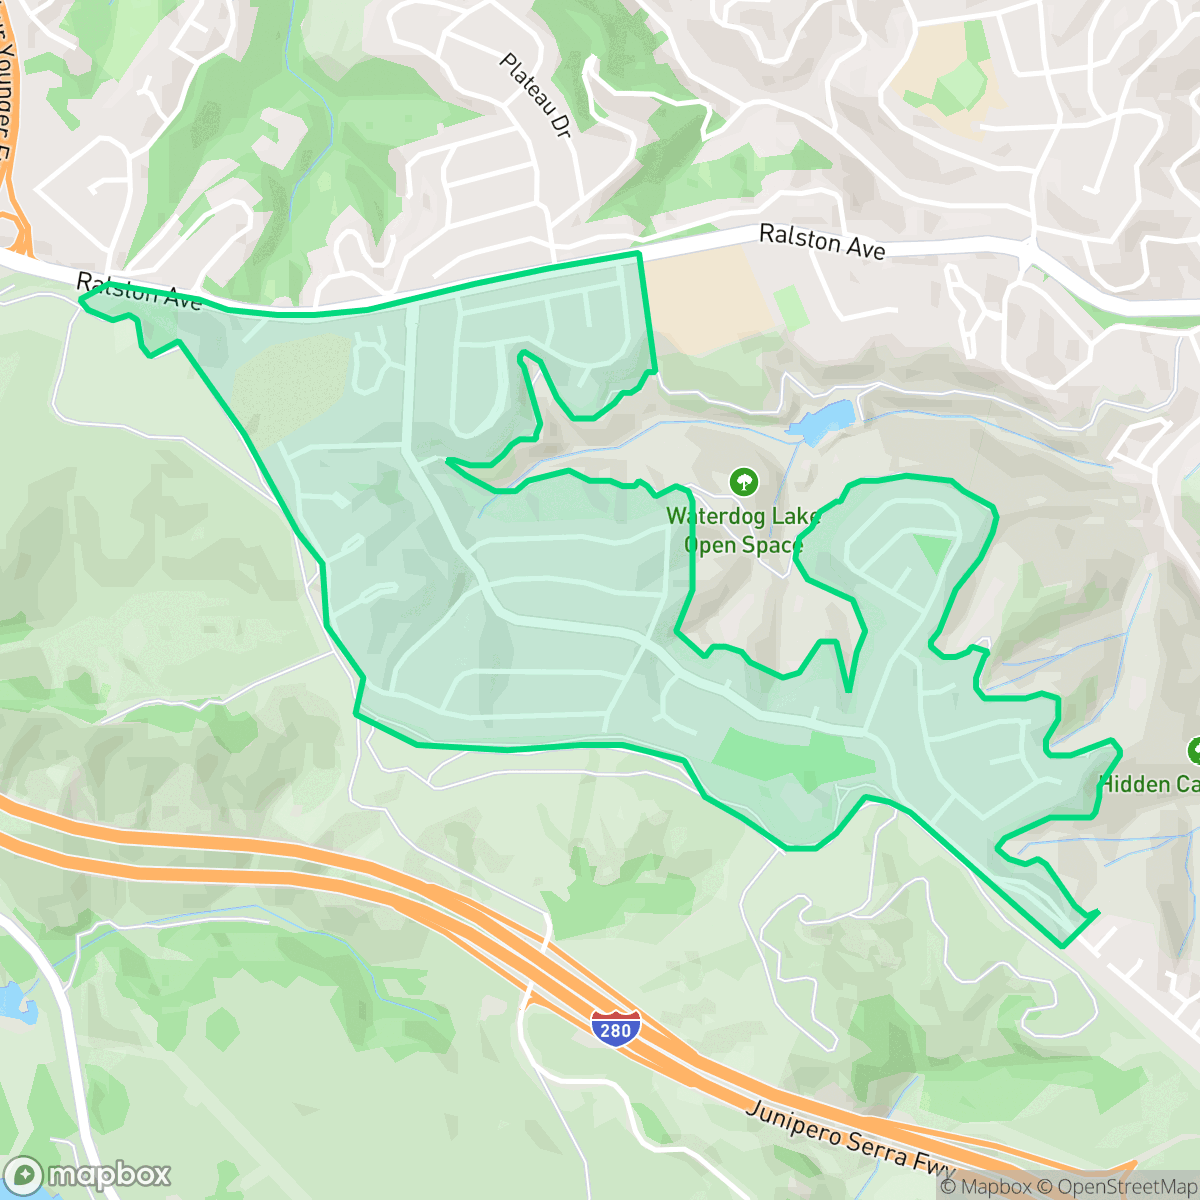
Belmont Heights is a quiet, low-density neighborhood in Belmont, California, characterized by its abundant open space and exceptional dog friendliness. Residents benefit from above-average walkability and access to top-rated schools, making it a serene residential enclave.
Key Highlights
About Belmont Heights
Belmont Heights offers a tranquil living environment defined by its low-density residential layout and proximity to expansive green spaces. The area maintains a distinct rural character despite its location in the heart of the Peninsula, providing a peaceful retreat from the surrounding urban centers. It is primarily residential, with quiet streets and a visual aesthetic that ranks highly compared to other parts of the city, according to iHuus data.
While the neighborhood excels in pet friendliness and educational access through highly regarded school districts, prospective residents should note specific environmental factors. The area experiences moderate noise levels primarily from road traffic and has a low flood safety rating. It is best suited for those who prioritize a quiet, pet-friendly atmosphere and high-quality schools over proximity to commercial activity or bustling nightlife.
Neighborhood Scores Across 15 Qualities
Residential spacing is consistent with the city average, offering a mix of moderate density and some buffer between adjacent properties.
Pedestrian movement is possible due to safe crossings and sidewalks on one side of the street, though connectivity is lower than the Belmont average.
Large homes and frequent upscale amenities contribute to a high level of visual interest. According to iHuus data, the aesthetic quality of this area is slightly above the Belmont city average.
Extensive access to large parks, trails, and open spaces makes this area much more pet-friendly than the Belmont average, according to iHuus data.
Expansive natural landscapes and significant vegetation define this area, which feels much more rural than the typical Belmont neighborhood according to iHuus data.
Sparse commercial activity and vast open spaces create a tranquil environment with very few local businesses. This area is notably more subdued and less active than the average Belmont neighborhood, according to iHuus data.
Steady traffic sounds from a nearby busy street are common here, which is slightly more noticeable than the average for the rest of the city.
Air quality in this area fluctuates between acceptable and unhealthy levels, representing a mix of conditions that is consistent with the city average. Sensitive groups may experience occasional concerns during certain periods, according to iHuus data.
No warehouses, industrial facilities, or hazard sites are present within the neighborhood. This area is entirely residential and features more open green space than the typical Belmont neighborhood, according to iHuus data.
Nearly all residents in this area are covered by health insurance, matching the average seen across Belmont. According to iHuus data, health insurance access is exceptionally stable in this neighborhood.
Voting patterns and census indicators reflect a deeply liberal community, aligning closely with the broader political landscape of Belmont.
Residents experience a balanced demographic mix of young adults, families, and older populations. This distribution is slightly more varied than the average seen across Belmont.
Coastal high-hazard zones and wave action present significant flood risks that are considerably higher than the Belmont city average. Residents should prepare for potentially elevated or prohibitive flood insurance costs, according to iHuus data.
Fire hazards in this area are notably higher than the city average, though standard mitigation measures are in place. According to iHuus data, residents should remain aware of local fire safety protocols due to the presence of moderate-risk vegetation and terrain.
Address-Level Insights for Belmont Heights


iHuus Neighborhood Intelligence Insights
Get address-level neighborhood insights for Belmont Heights
- Street-level scores — see how individual blocks compare, not just neighborhood averages
- Micro-zone boundaries — identify quiet pockets, flood boundaries, and walkable clusters before you visit
- 15 dimensions in full — walkability, noise, air quality, school quality, insurance coverage, population age profile, urban/rural index, and more
- Boundary risk alerts — know if your address sits near a block boundary where scores drop, the kind of detail no listing will ever mention
- School insights — individual school ratings and insights, not just district-level data
- Compare before you commit — side-by-side data across neighborhoods, down to block precision
No credit card required
Compare with Any Neighborhood
| Dimension | Belmont Heights | Central |
|---|---|---|
| 🚶 Walkabilityavg 7.7 | ||
| 🔊 Acoustic Comfortavg 4.56 | ||
| 🤫 Privacy Indexavg 5.95 | ||
| 🎨 Visual Appealavg 7.72 | ||
| 🐕 Dog Friendlinessavg 8.14 | ||
| 🗺️ Urban-Rural Indexavg 7.2 | ||
| ✨ Neighborhood Vibeavg 4.23 | ||
| 🏥 Health Insurance Coverageavg 9.26 | ||
| 🌿 Air Qualityavg 6 | ||
| 🏭 Industrial Proximityavg 9.46 | ||
| 🌊 Flood Safetyavg 5.37 | ||
| 🗳️ Ideological Leanavg 9.71 | ||
| 👥 Population Age Profileavg 4.96 | ||
| 🔥 Fire Safetyavg 0.71 | ||
| 🏫 School Quality |
Belmont Heights Rankings
School Districts Serving Belmont Heights
School Insights for Belmont Heights
Below average outcomes; significant attendance and academic challenges.
School Insights
See what's really behind every school rating near Belmont Heights
- Individual school ratings — each school's own score with outcome context, not just a district average
- Enrollment & class size data — student-to-teacher ratio and how it compares to the state average
- Full demographics breakdown — ethnicity and gender composition for every school in the enrollment zone
- Every school in the district — all schools within the enrollment boundary ranked by rating, not just the closest one
- Grade levels & benchmarks — elementary through high school, with below/above state-average flags
No credit card required